Withthegrid is an IoT asset monitoring platform for infrastructure - it allows you to monitor assets, connect IoT sensors, visualize data, detect anomalies and manage workflows. In this section, we describe how to implement The Things Stack integration with the Withthegrid platform.
Requirements
Use a requirements subheading to list requirements/prerequisites.
- Access to the Withthegrid platform. To get started go to
https://app.withthegrid.com/and login with your credentials. If you did not receive any credentials via e-mail you can sign up here for a 14 day free trial.
Architecture
The Withthegrid asset monitoring platform has two types of environments, monitoring environments and connectivity environments.
Monitoring environments
Monitoring environments are environments where the end users obtain an overview of all the issues and actions related to its assets.
Locations form the core of the asset monitoring platform. At each location, measurements are recorded. In our example, a monitoring environment with the name Infrastructure company ACME will be created (Figure 1). We will create a location ACME Headquarters where we will connect a Dragino - LWL02 water leak sensor device. Each location can be consisted of multiple location ports. These are ports onto which measurements are recorded. Here, we create a location port Entrance where the sensor is located. The device can be assigned with several channels that can be linked with any location port. This way, the right measurements can be pushed to desired locations.
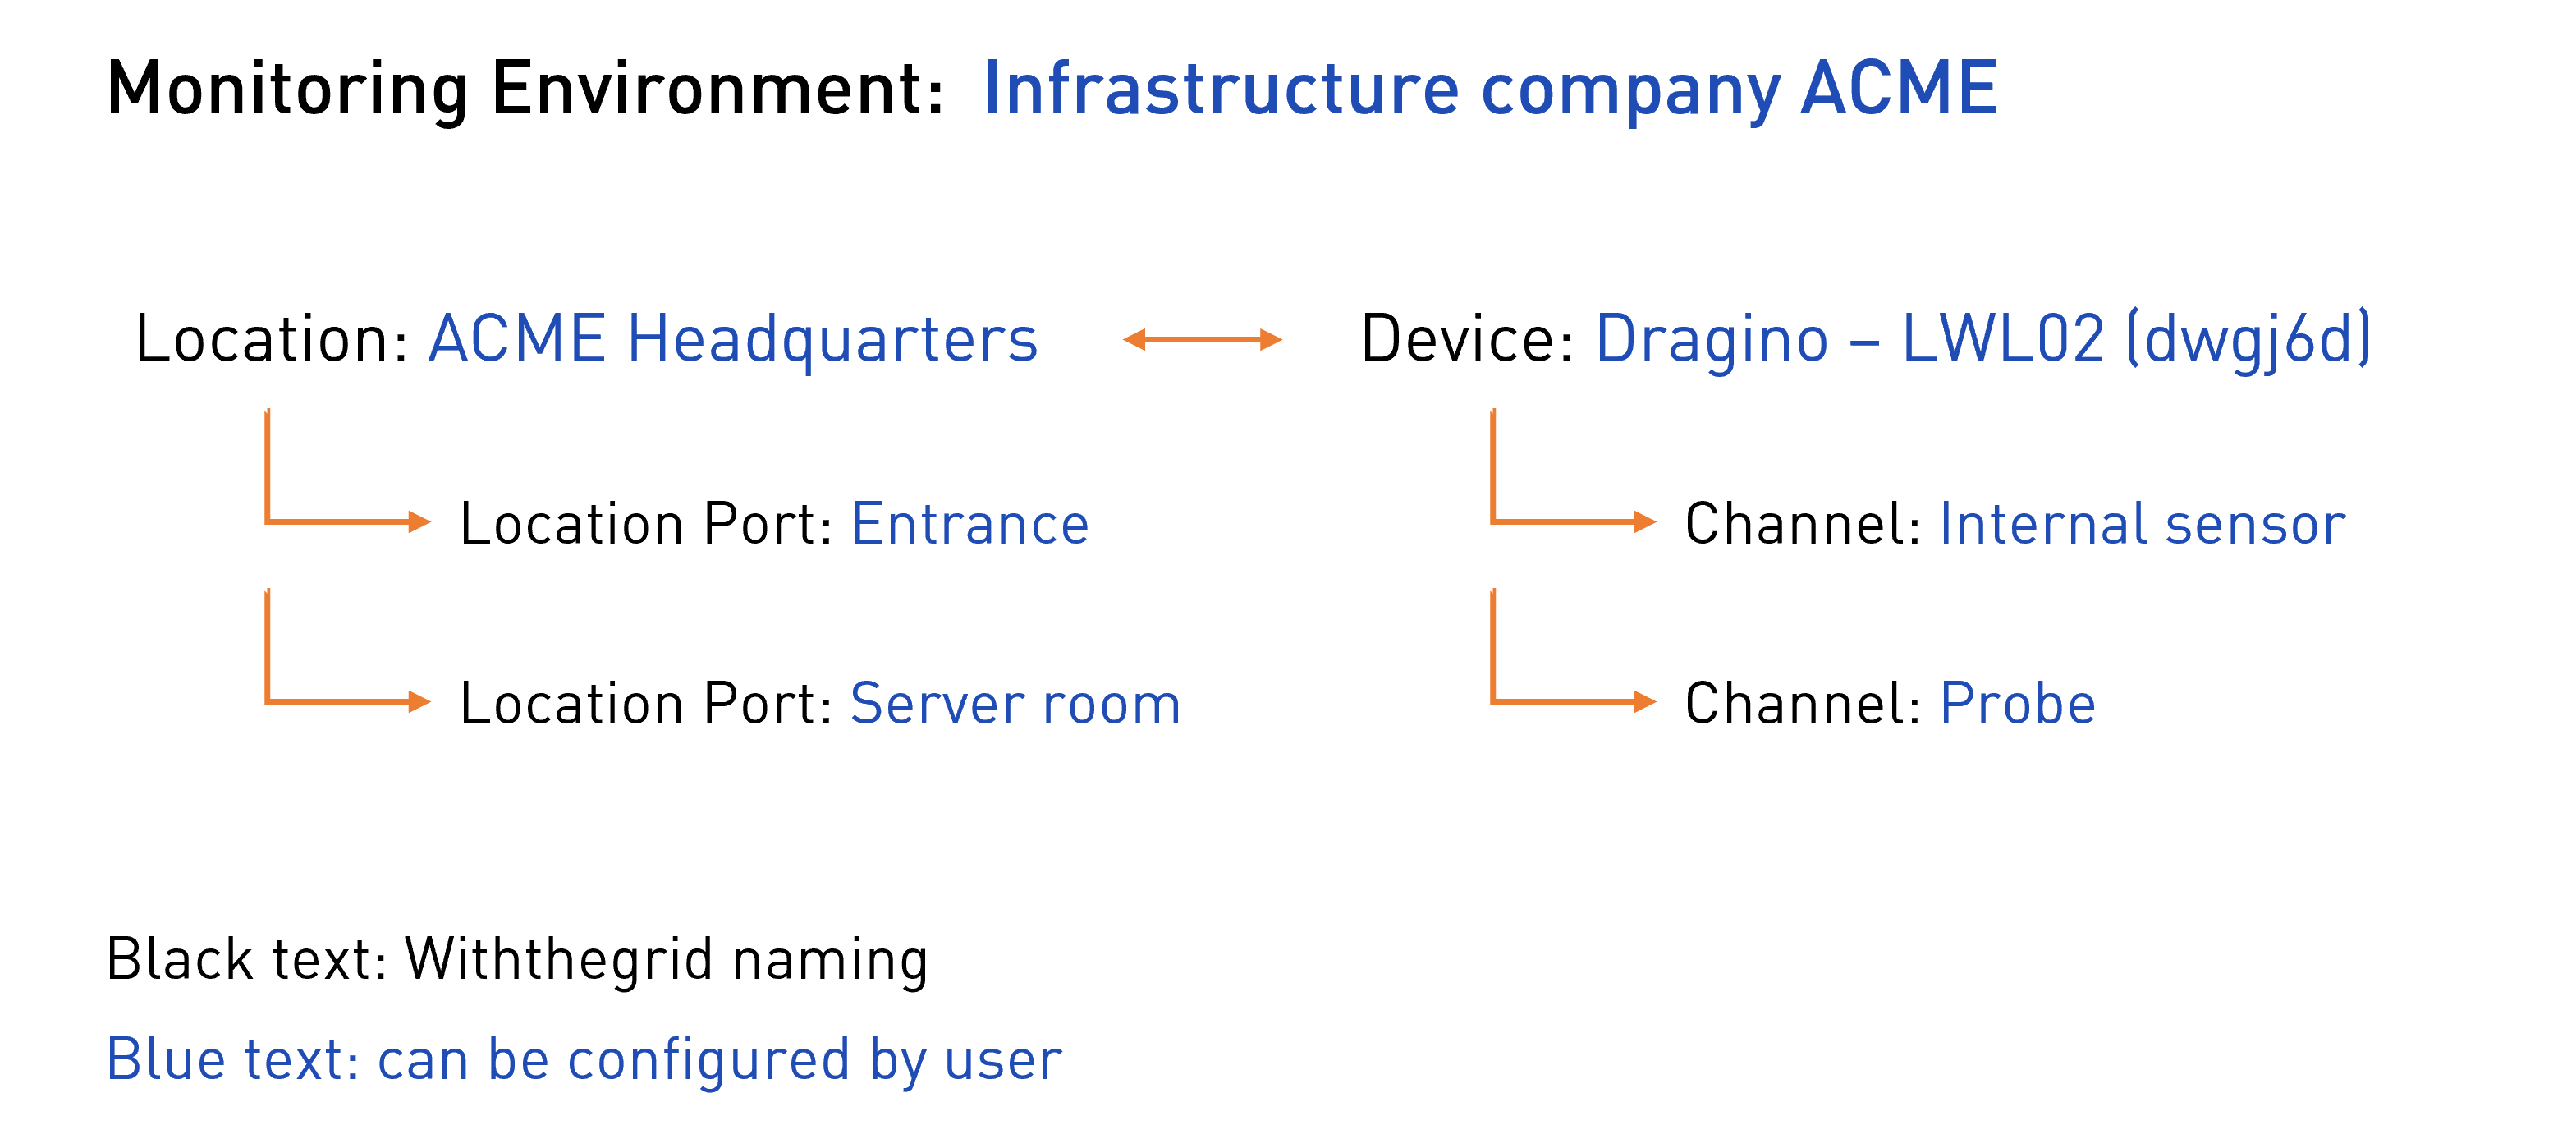
Figure 1. Example of the setup of monitoring environment
Connectivity environments
Connectivity environments are environments where users configure their devices or data streams and assign them to one or multiple monitoring environments.
In the connectivity environment, you can configure secure access for your devices through HTTPS webhooks or client certificates. You can define event handlers in TypeScript that parse incoming payloads into measurement reports, return instructions to devices and monitor device health.
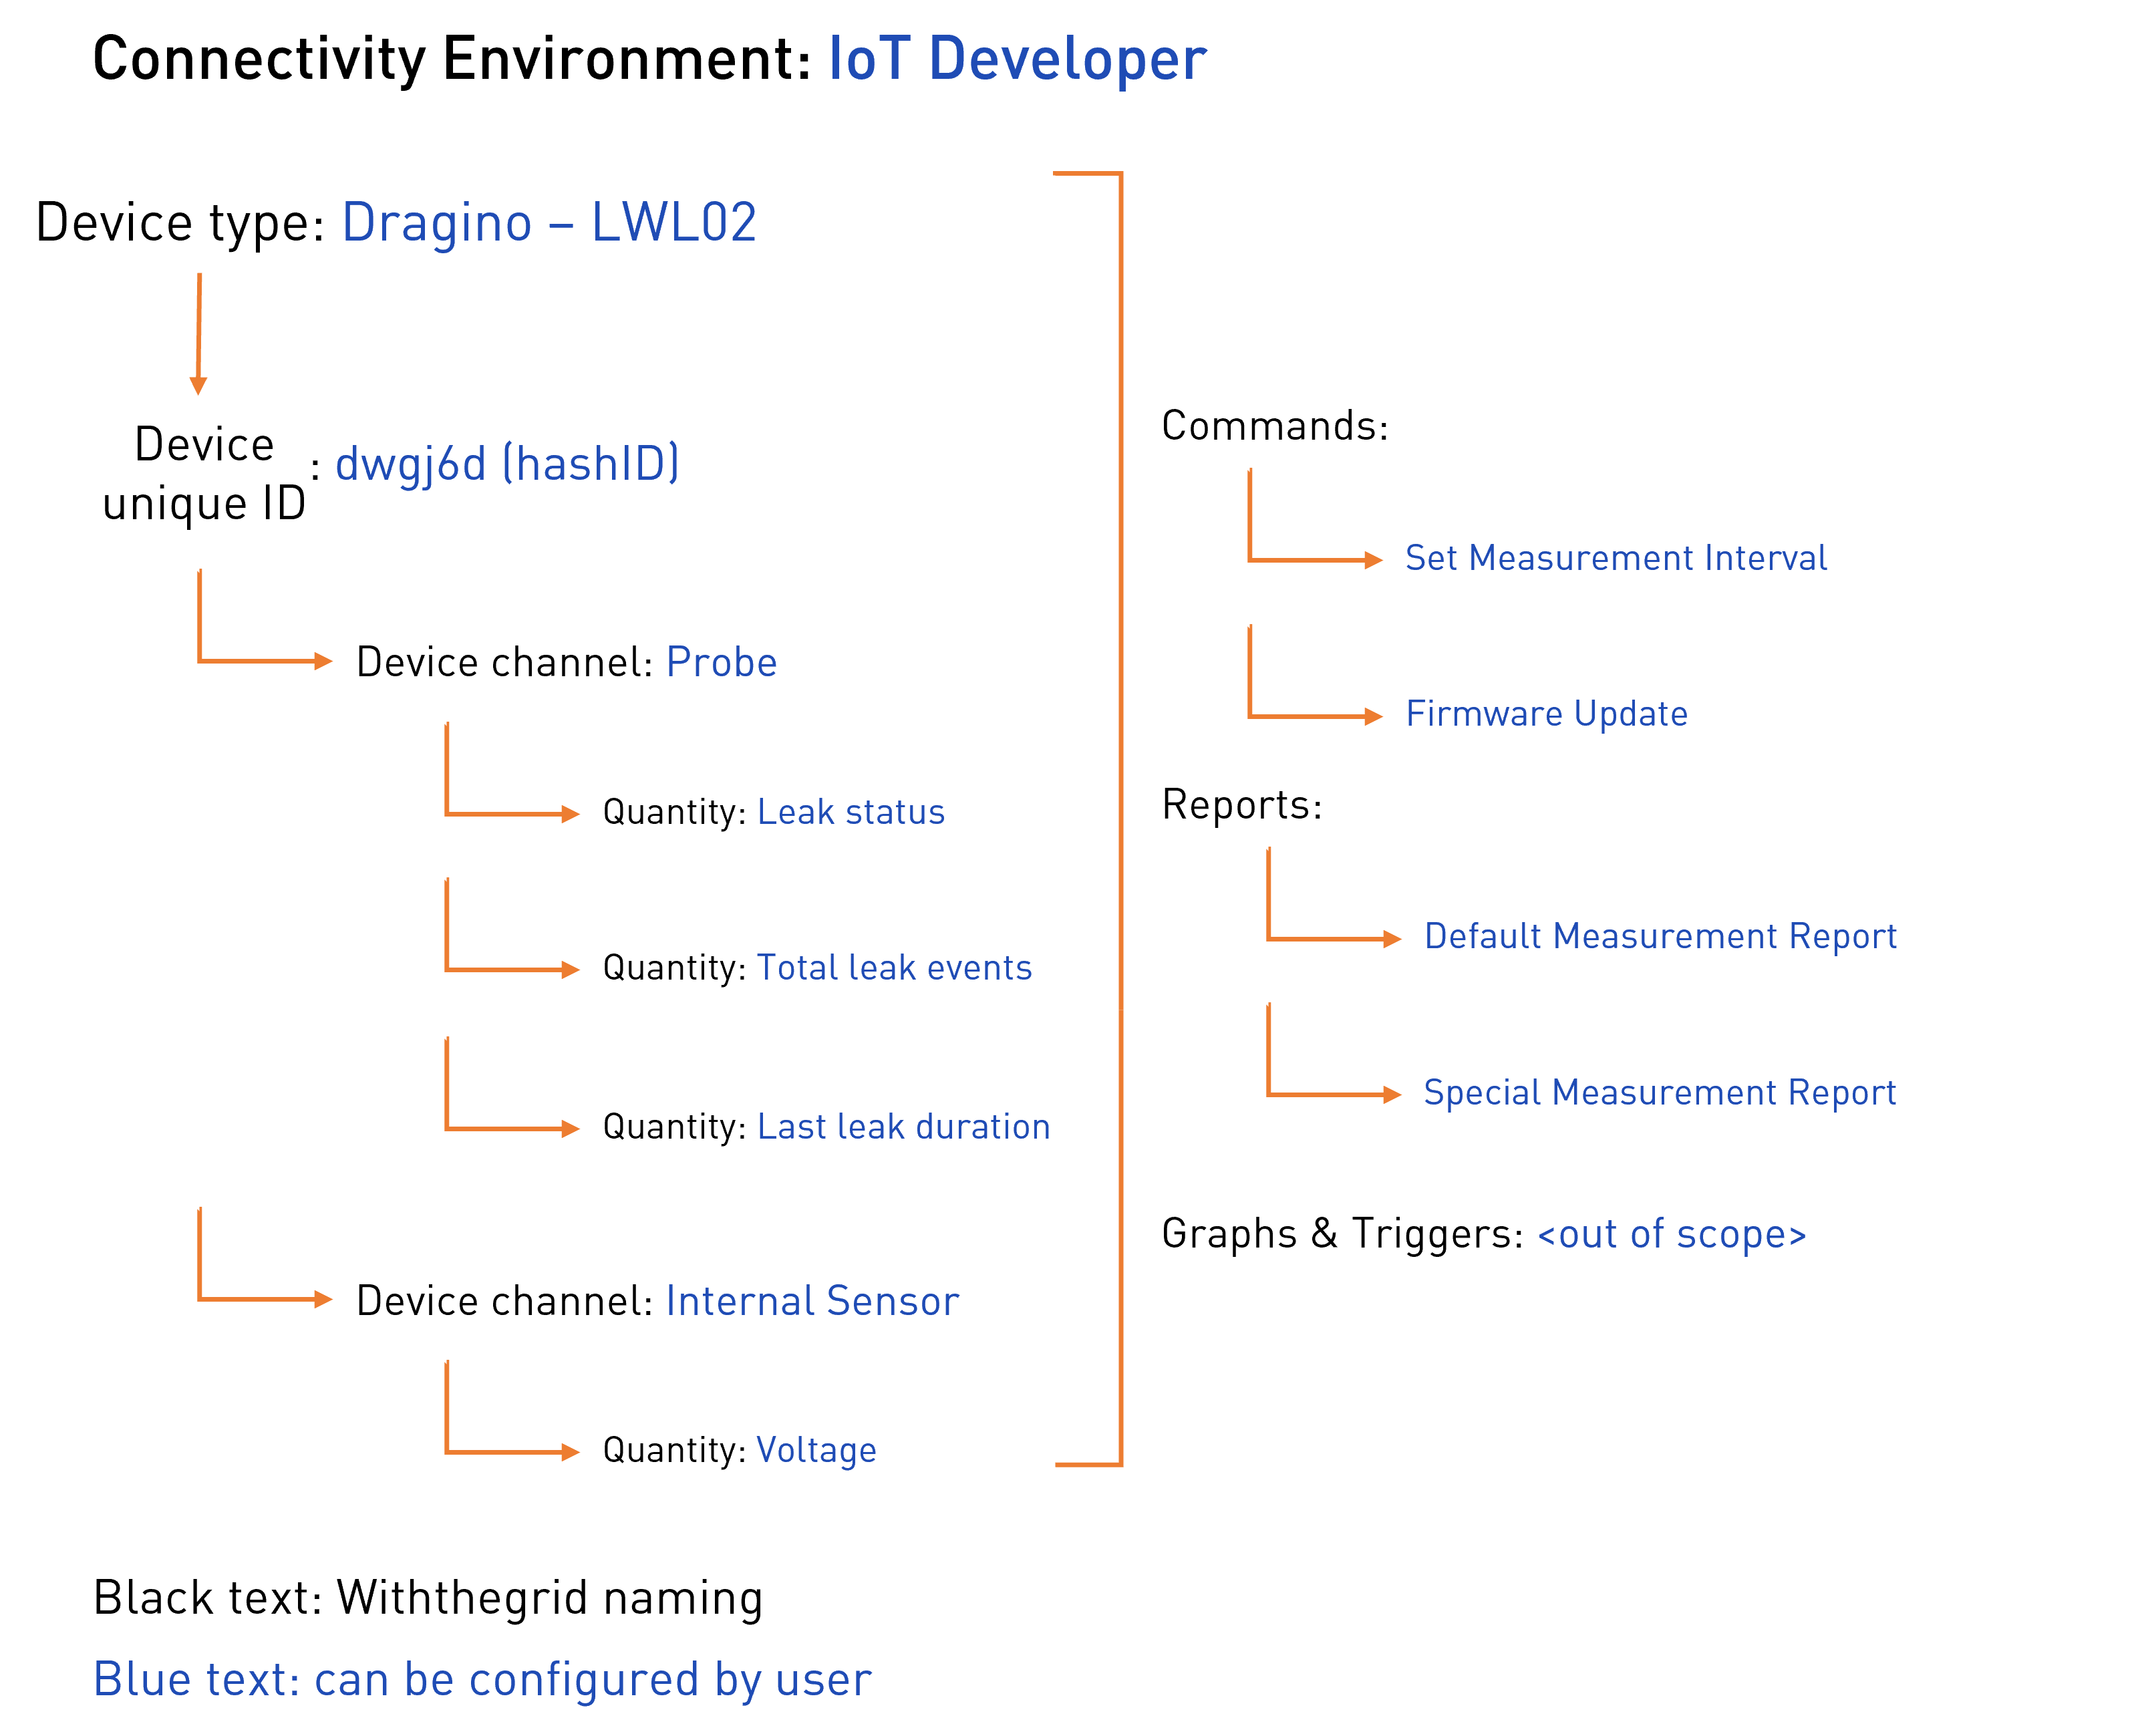
Figure 2. Example of the setup of connectivity environment
In the following example, Dragino - LWL02 device will be connected to the platform. Every instance of this device type (the physical device) will obtain a unique device ID by the platform which we call a hashID. Each device can have multiple device channels where measurements are pushed. An example of a device channel is Internal Sensor. A user can define which measurements will be stored in this channel. The quantity which will be stored in this channel will be the operating voltage. Quantities related to the channel Probe are leak status, total leak events, and last leak duration. Custom commands can be defined in the connectivity environments such as a request to change the measurement interval of a connected device but this is out of the scope of this tutorial.
Finally, the connectivity environment is used to define the structure of measurement reports.
Simplified dataflow model
A simplified dataflow model is shown in the figure below. An HTTP request from The Things Stack is processed by the webhook. Webhooks define the communicating device type, its unique identifier (e.g. IMEI number) and forward this information together with the payload to the corresponding device type event handler. Subsequently, the event handler runs a report parser. The platform offers full flexibility on how to parse payload into condition reports, using a custom TypeScript parser function. The parser should then convert the payload string (probably applying JSON.parse first) into an actual report with measurements.
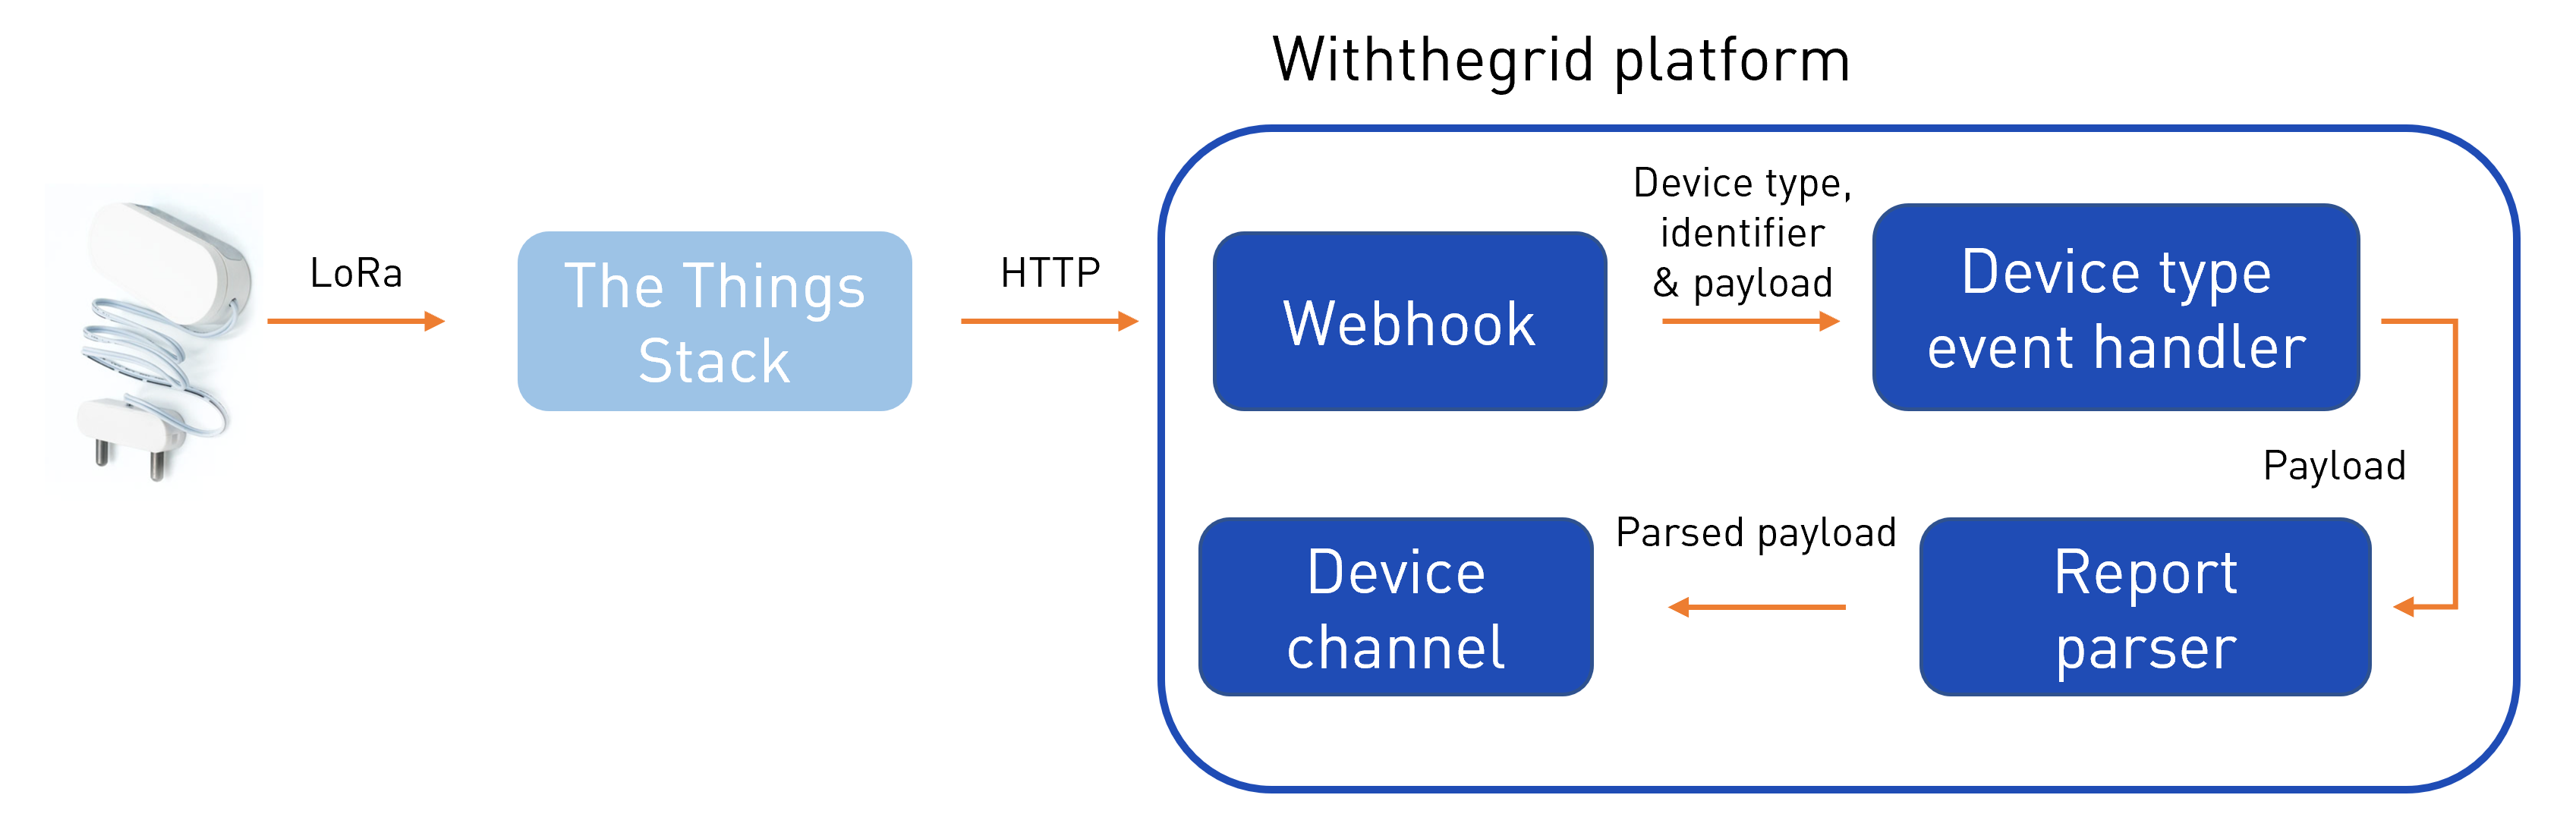
Figure 3. Simplified dataflow model of the Withthegrid platform
Now, let’s implement the integration!
Step 1: Creating monitoring and connectivity environments
To create a new connectivity environment, simply enter the desired name and select CREATE.

Figure 4. New connectivity environment
The same procedure can be followed to create a new monitoring environment. To create the first location in the monitoring environment, locate the desired place on the map and Add a new location.
Figure 5. Add new location
To navigate between the environments, click on the arrows located in the top left corner.
Step 2: Creating a new webhook
The first step in integrating the Withthegrid platform with The Things Stack is to create a new webhook. Webhooks can be found in the connectivity environment, under Device access/Webhooks. To create a new webhook, click + in the right bottom corner.
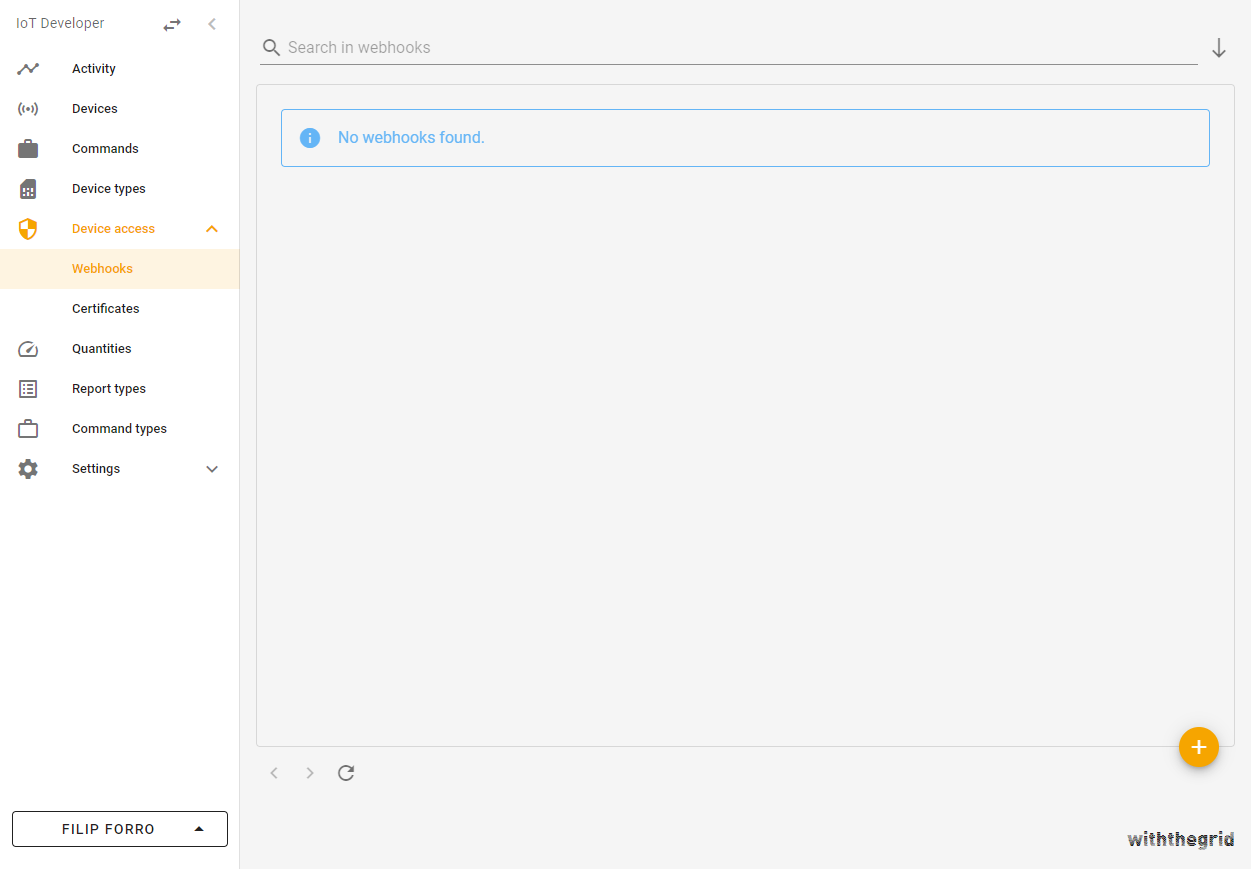
Figure 6. Webhooks overview
Select the desired webhook name and click ADD.
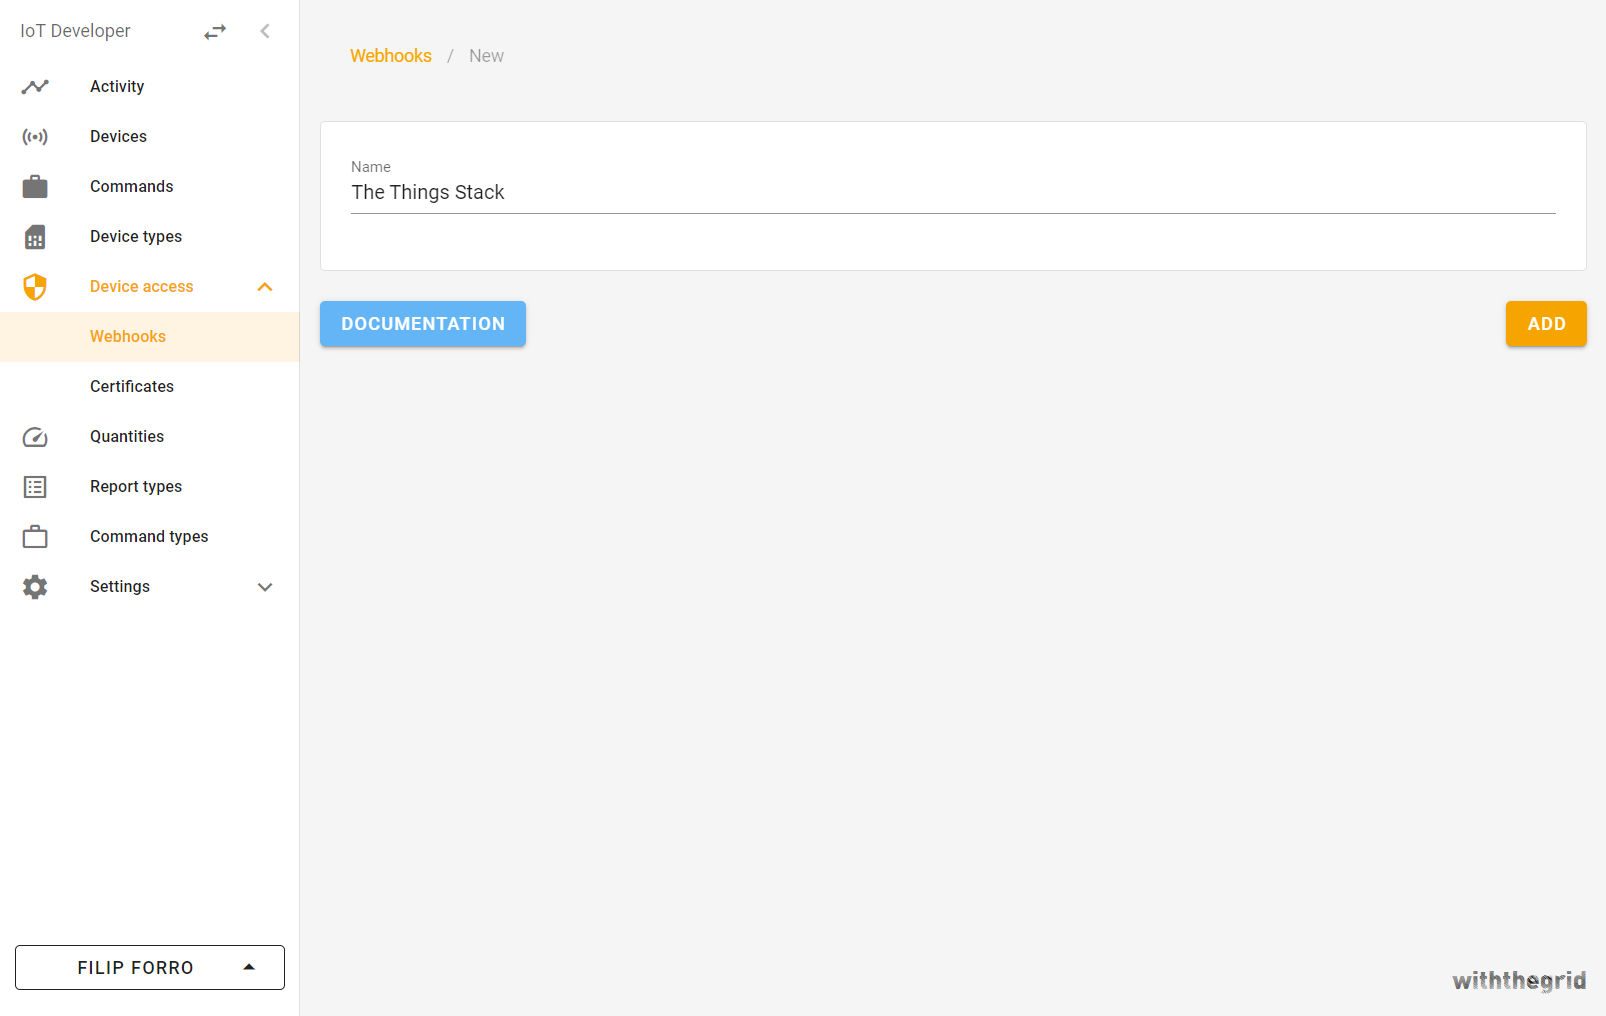
Figure 7. Add a new webhook
The platform will generate a webhook URL which we can use later to connect with The Things Stack.
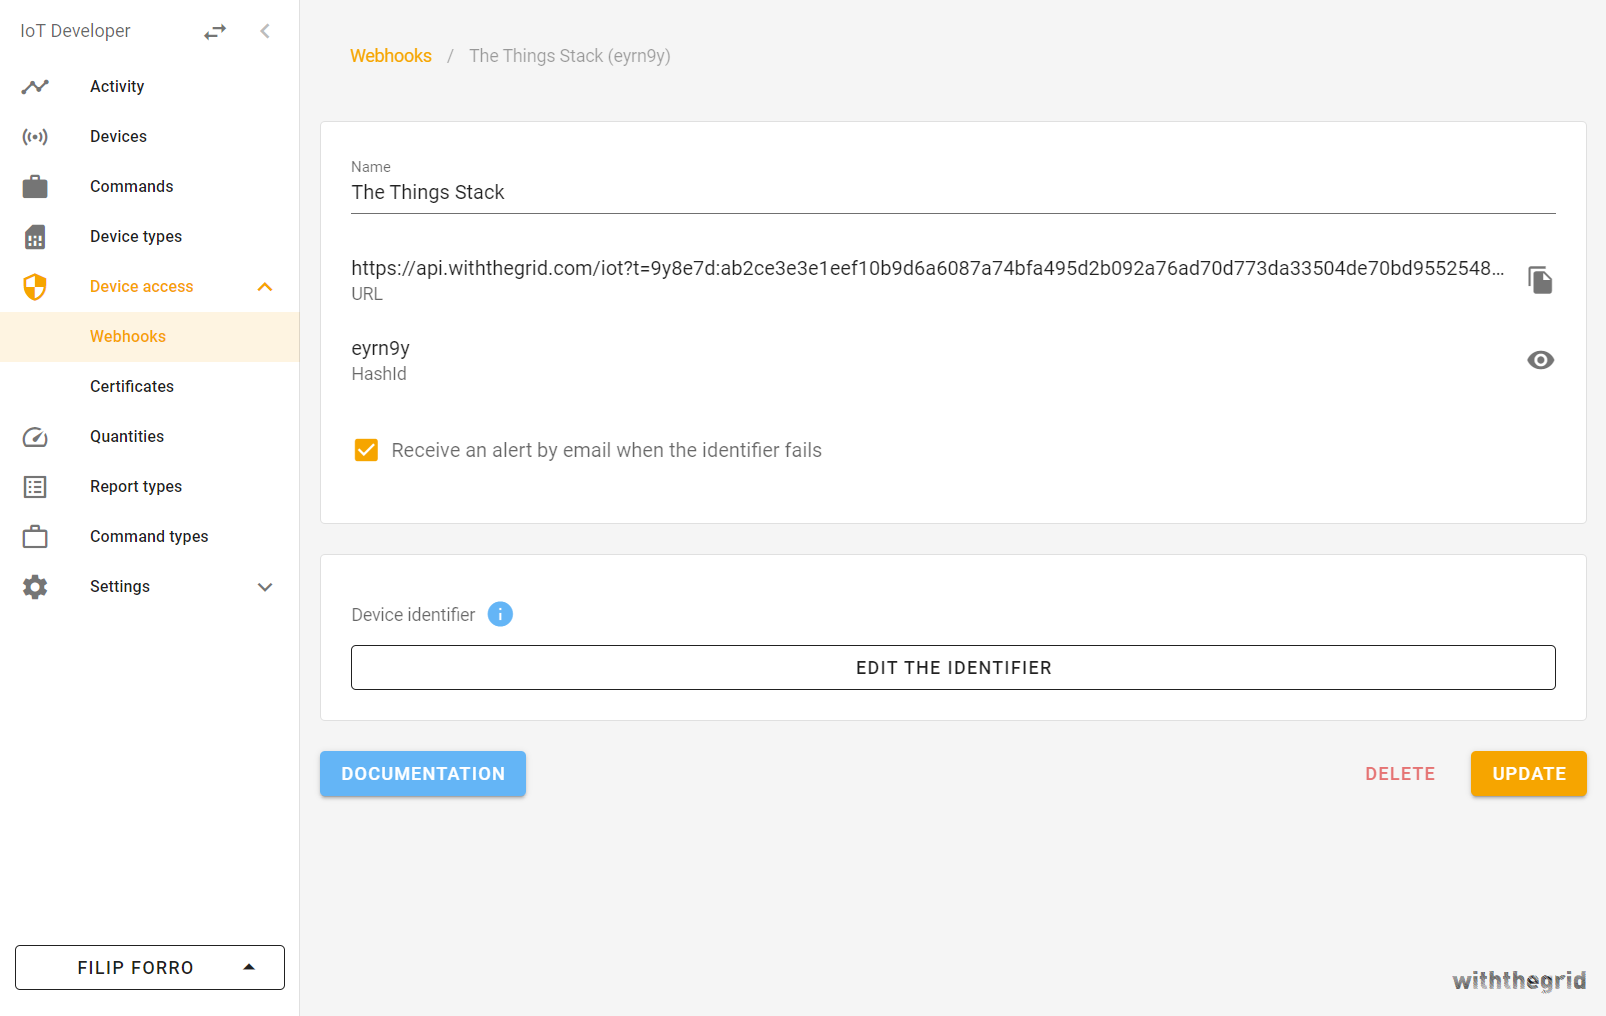
Figure 8. New webhook
Step 3: Creating and configuring a new device type
A new device type can be created in a connectivity environment by navigating to Device types. This page shows an overview of all the device types that are available in your environment. Let’s create the first device type by clicking + in the bottom right corner.
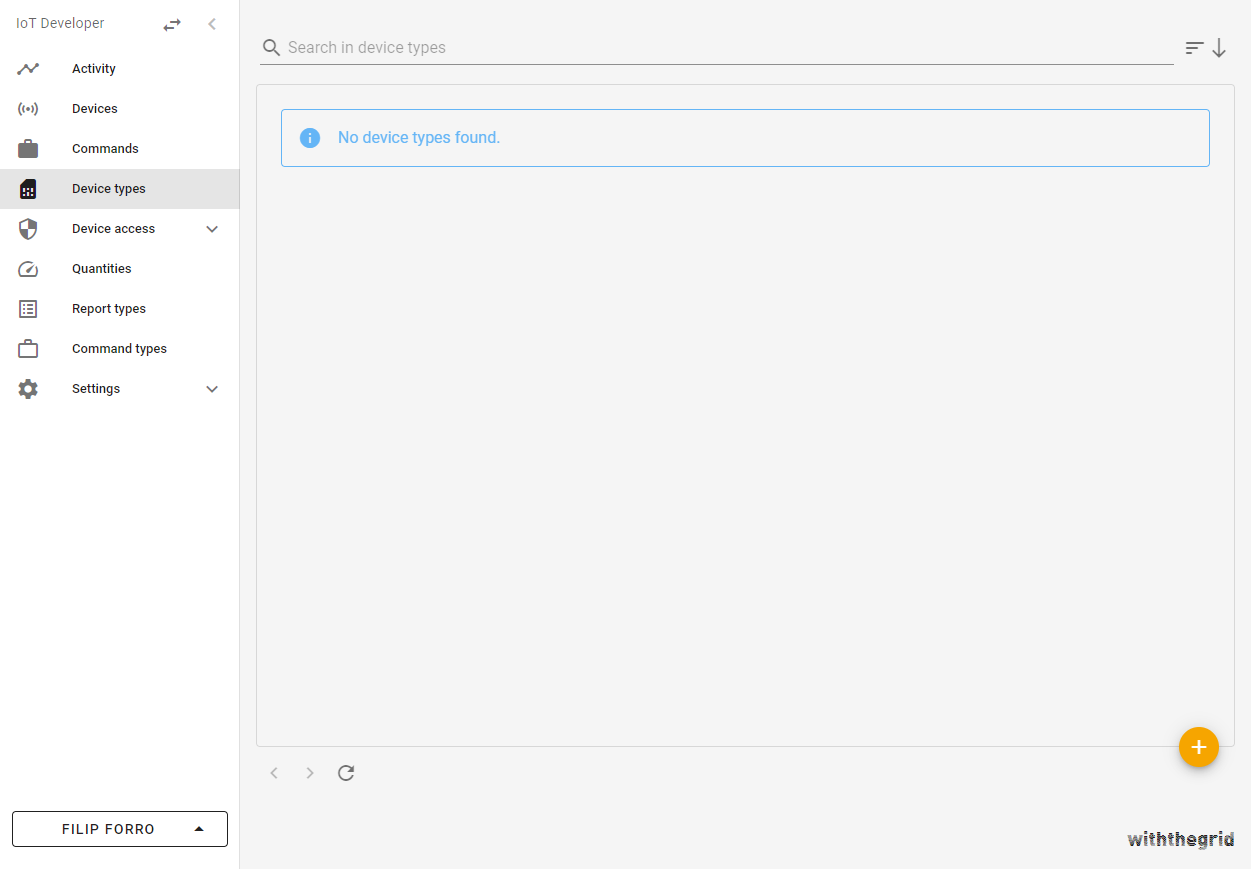
Figure 9. Device types overview
Name the new device type. At this point, we can also change the default name of the device channel to Internal Sensor. Use the same name for default name for port. This is where internal battery voltage measurements will be pushed.
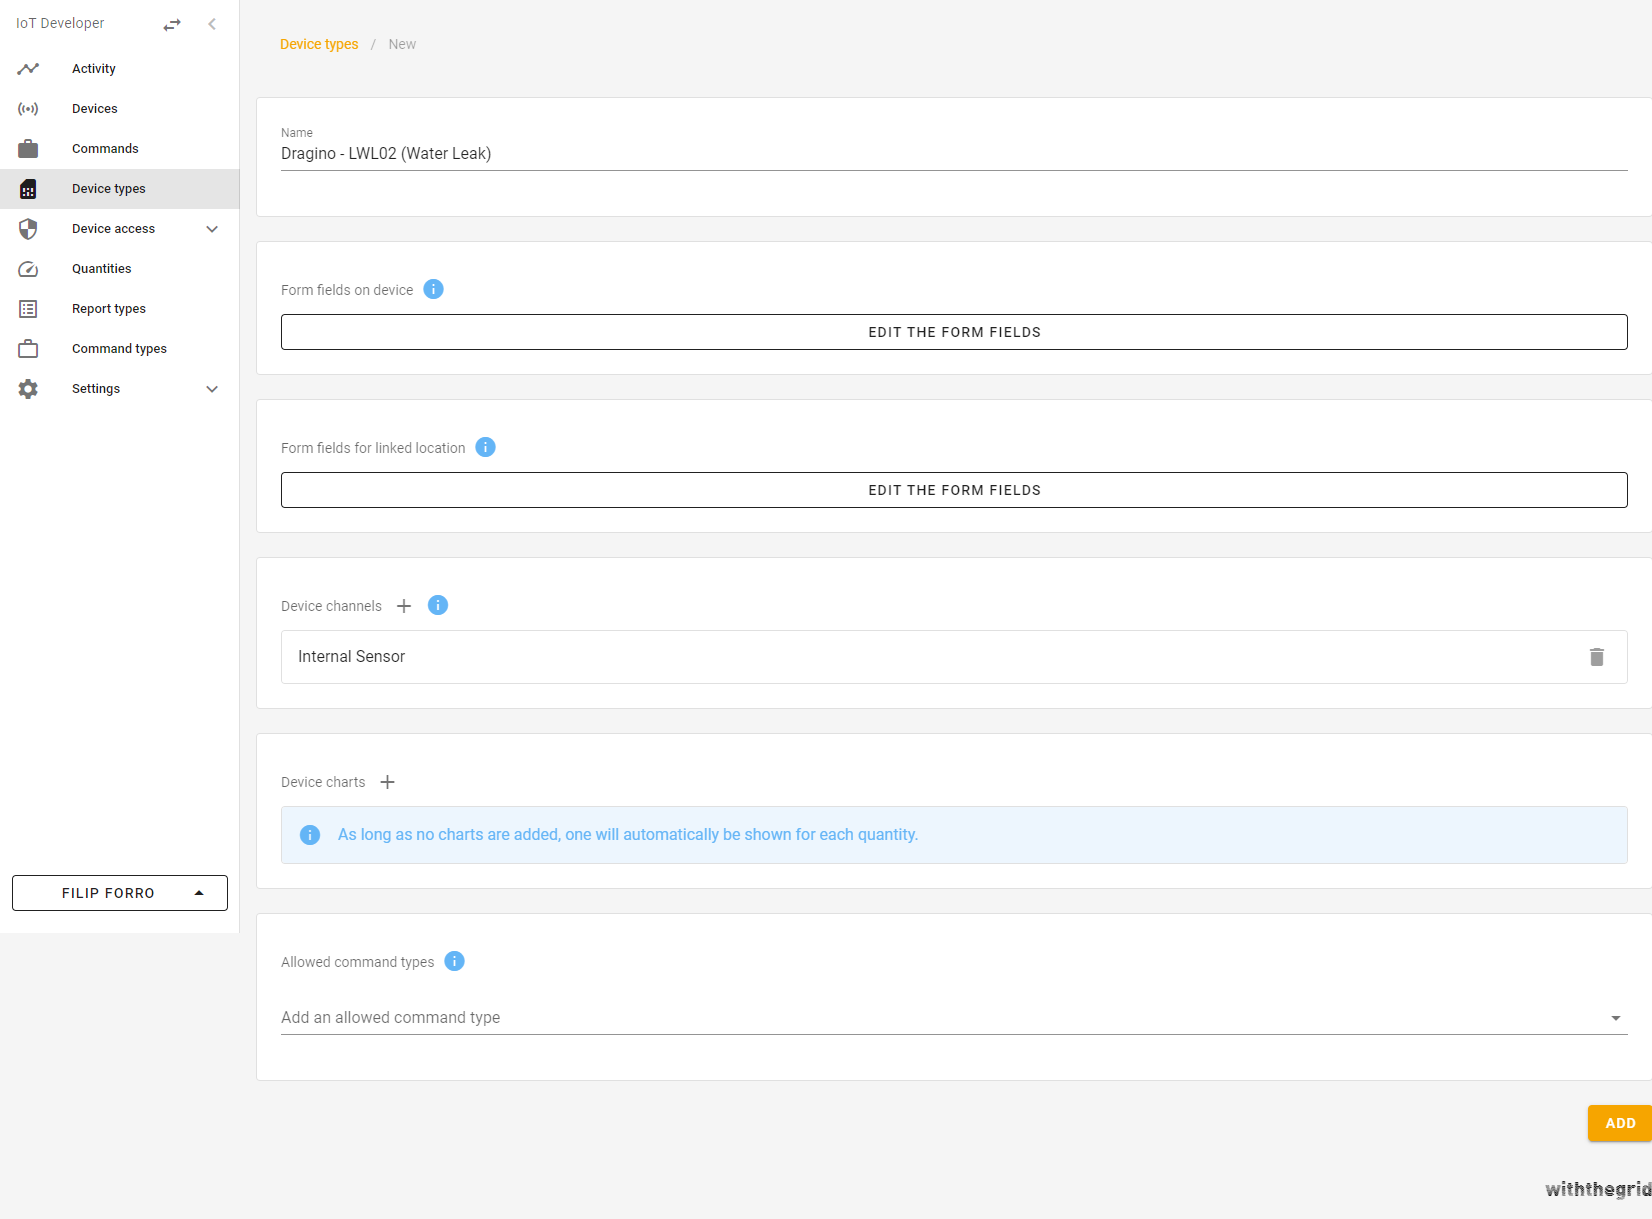
Figure 10. Add a new device type
Let’s create one additional channel (Probe), where we will push measurements related to the water leak.
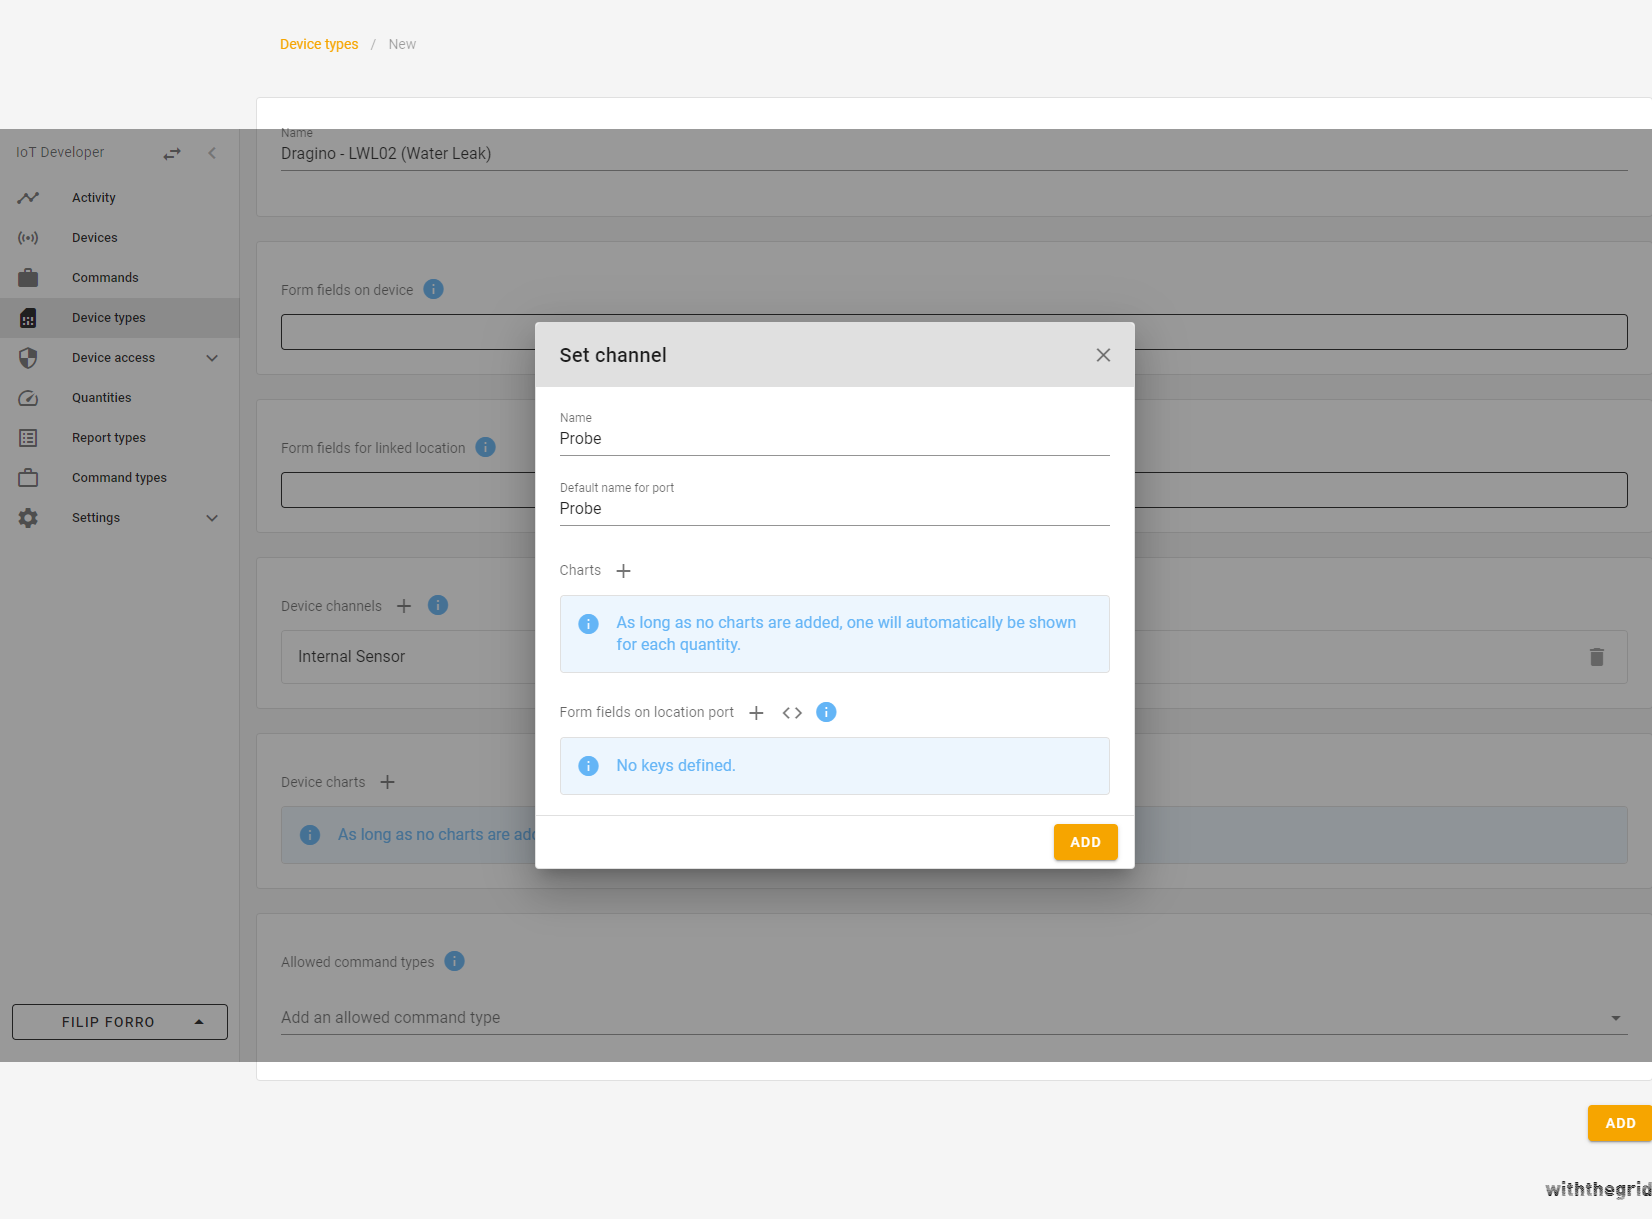
Figure 11. Set channels
Click ADD to set the channel and click ADD to update and save the changes.
Withthegrid’s new event handler will validate the incoming request and pass the payload to the corresponding report parser which will parse incoming payloads into measurement reports. The new device type will be given a new hashID (e.g. 4djrvd) which is a unique ID that identifies the event handler of Dragino - LWL02.
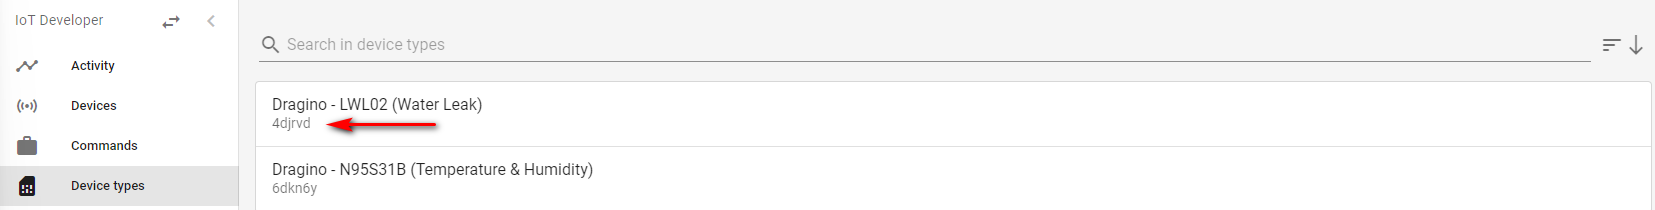
Figure 12. List of existing device types
Step 4: Creating a new report type and quantities
For each report, a report parser can parse the incoming payload. To create a new report, click + in the bottom right corner.
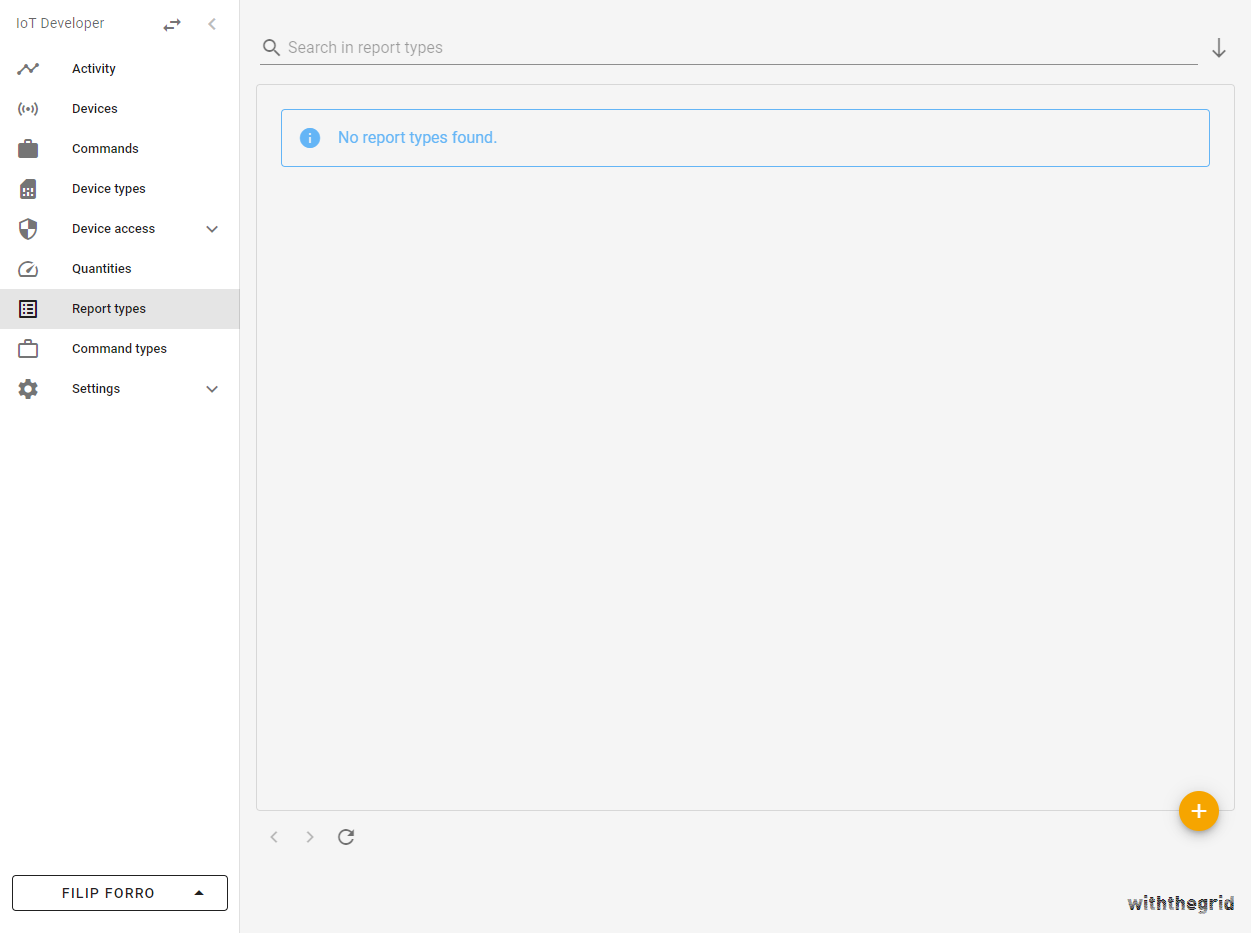
Figure 13. Report types overview
Follow the same steps as before to ADD the new report type.
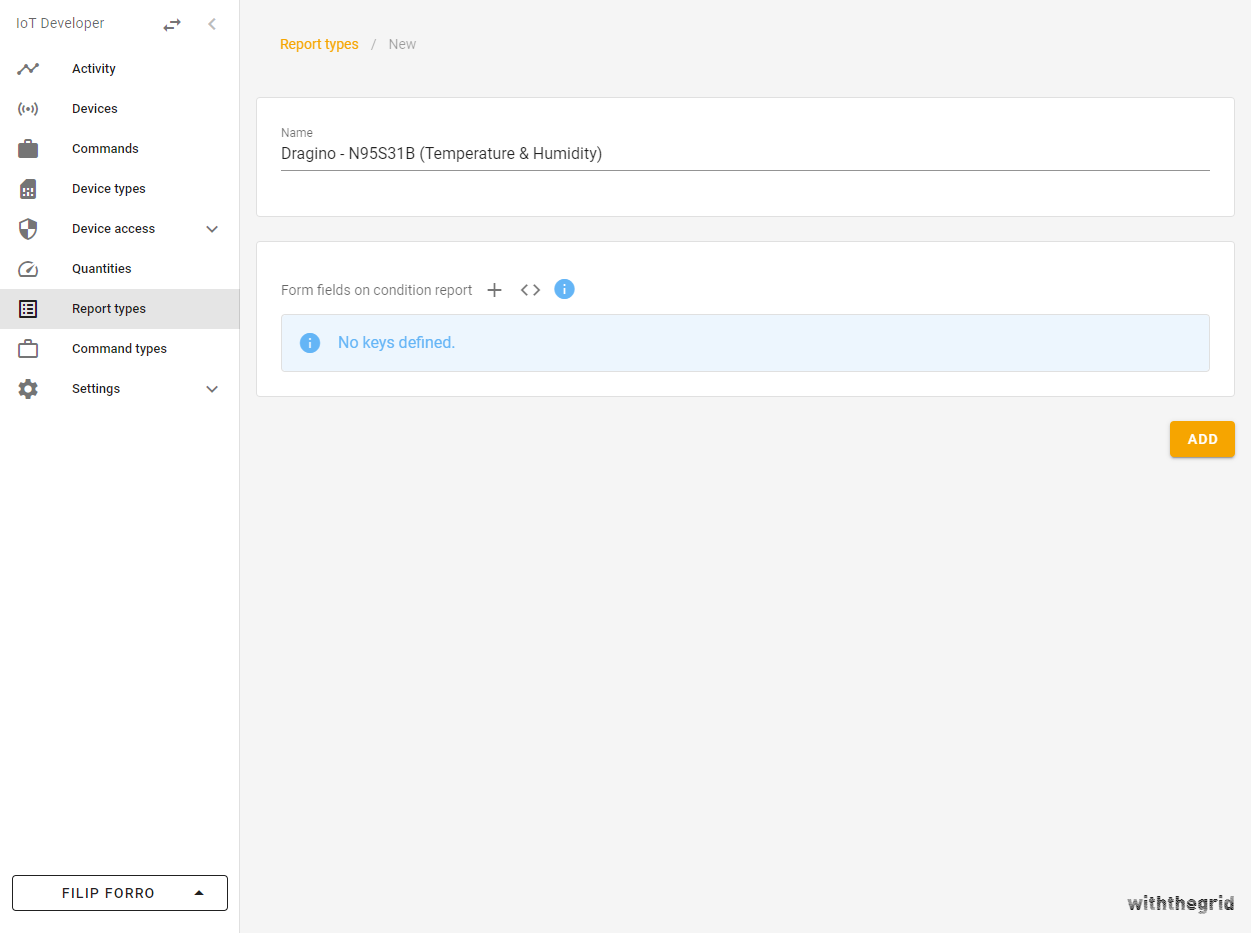
Figure 14. Add a new report parser
In the report parser, we will correctly parse the incoming payload into a measurement report. A new report type will be given a hashID (e.g. eyr96d). Note that the hashID is automatically created and will be different for everyone.
The quantities of interest in this example are voltage, leak status, total leak events and last leak duration. Custom quantities can be found in the panel under option Quantities. To create a new quantity, select +.
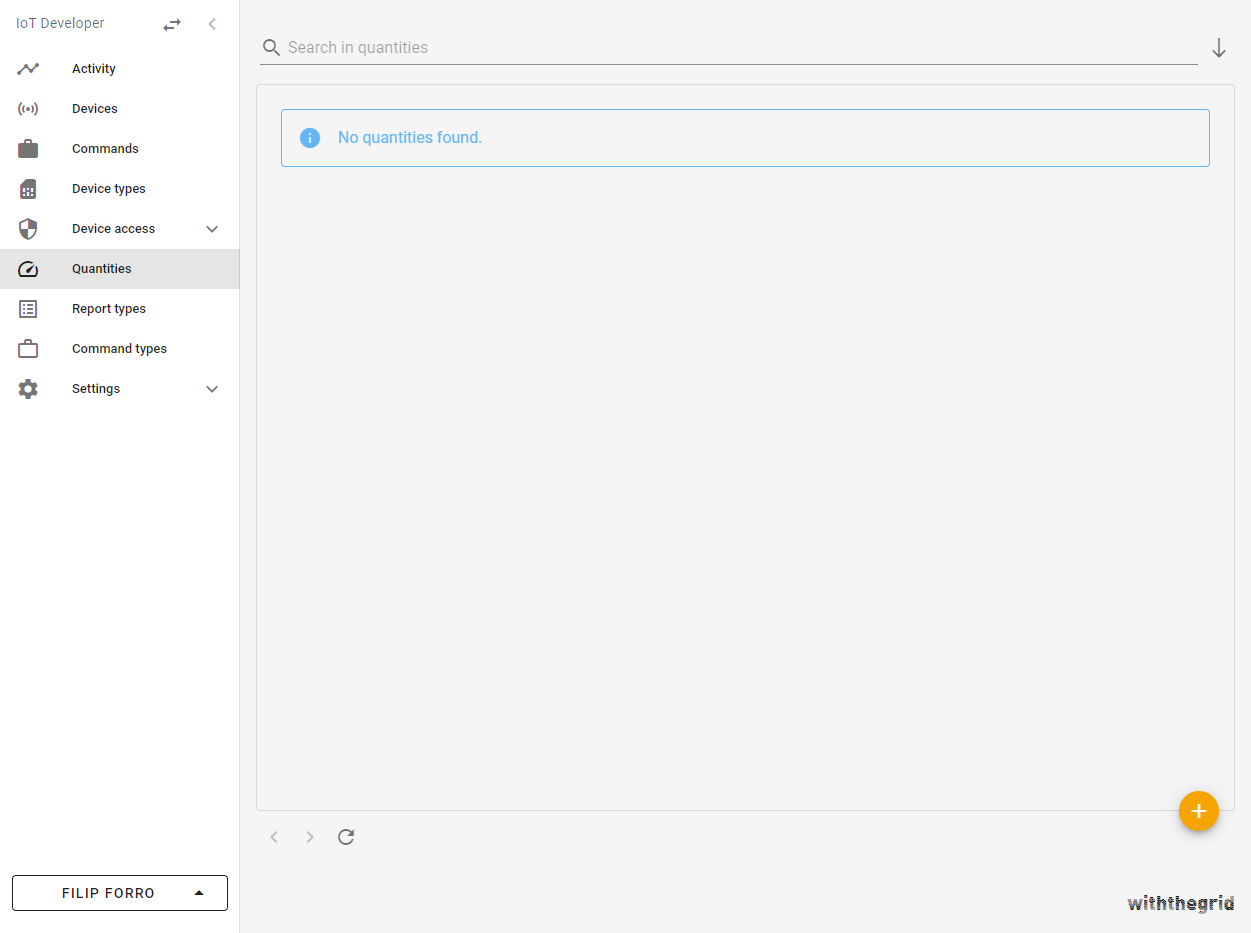
Figure 15. Quantities overview
Enter the quantity name Voltage and unit V. To create the quantity, select ADD.
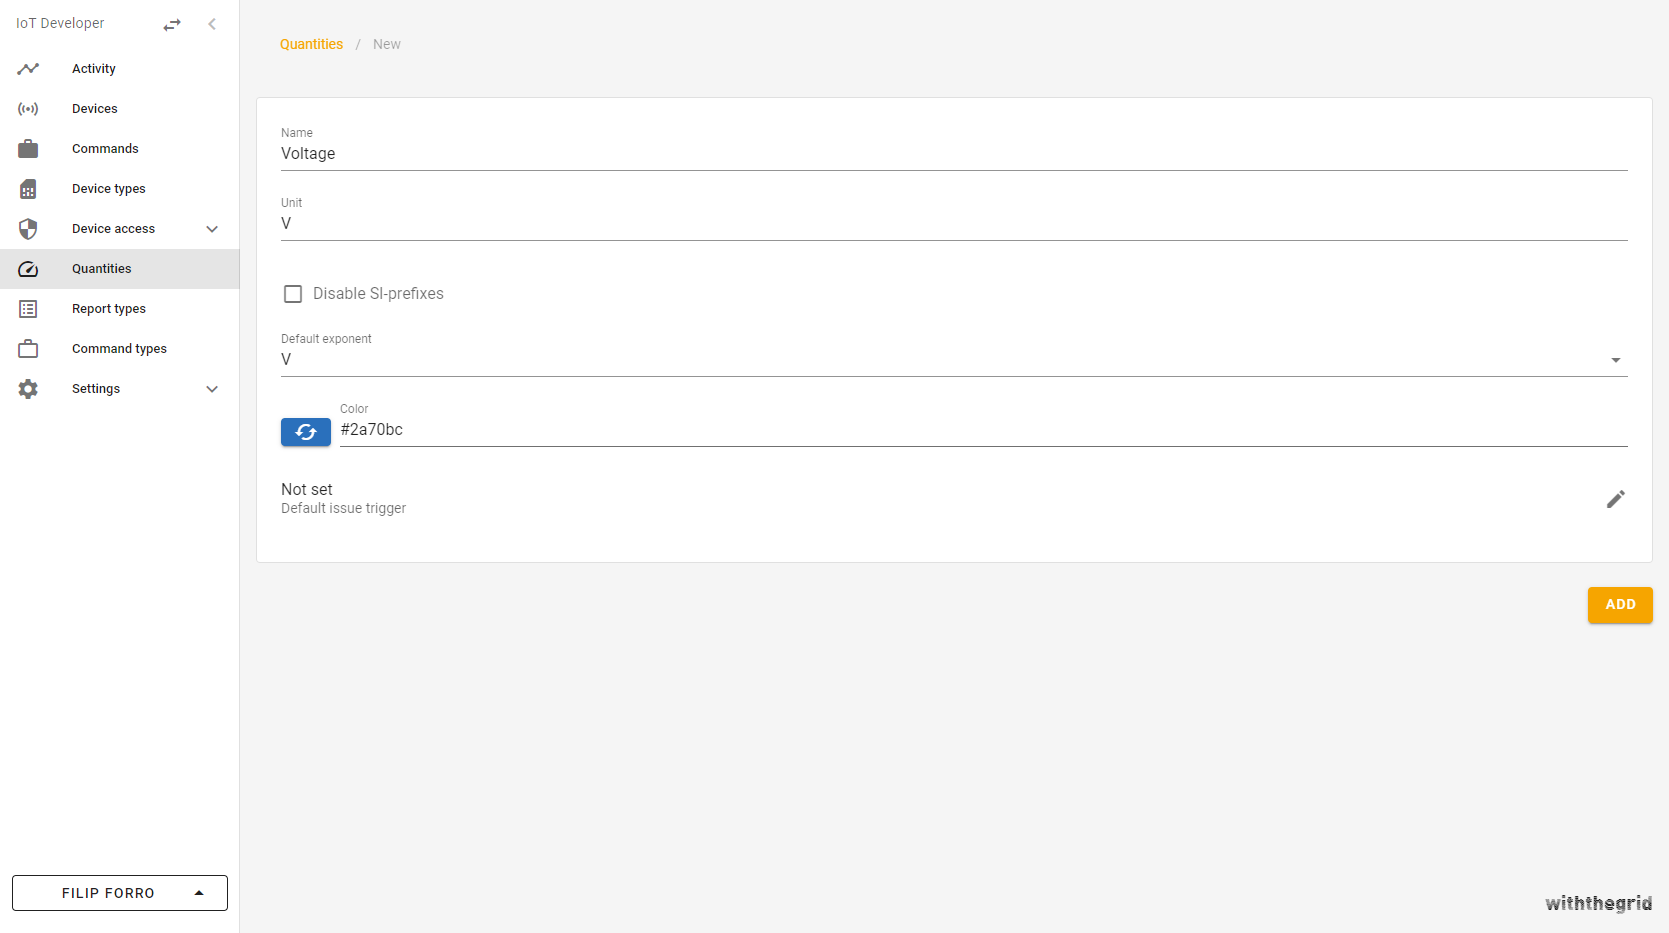
Figure 16. Add a new quantity
After selecting ADD, a hashID will be created for the newly created quantity. We will create Leak status, Total leak events, and Last leak duration quantities by following the same procedure. For unitless quantities, just enter space. Leak duration is in min according to the datasheet. In this example, the voltage, leak status, total leak events, and last leak duration hashIDs are yl4wwy, dp2v9d, yzrwny, and d4rwrd, respectively. The hashIDs will be used in the report to identify the correct measurement quantity.
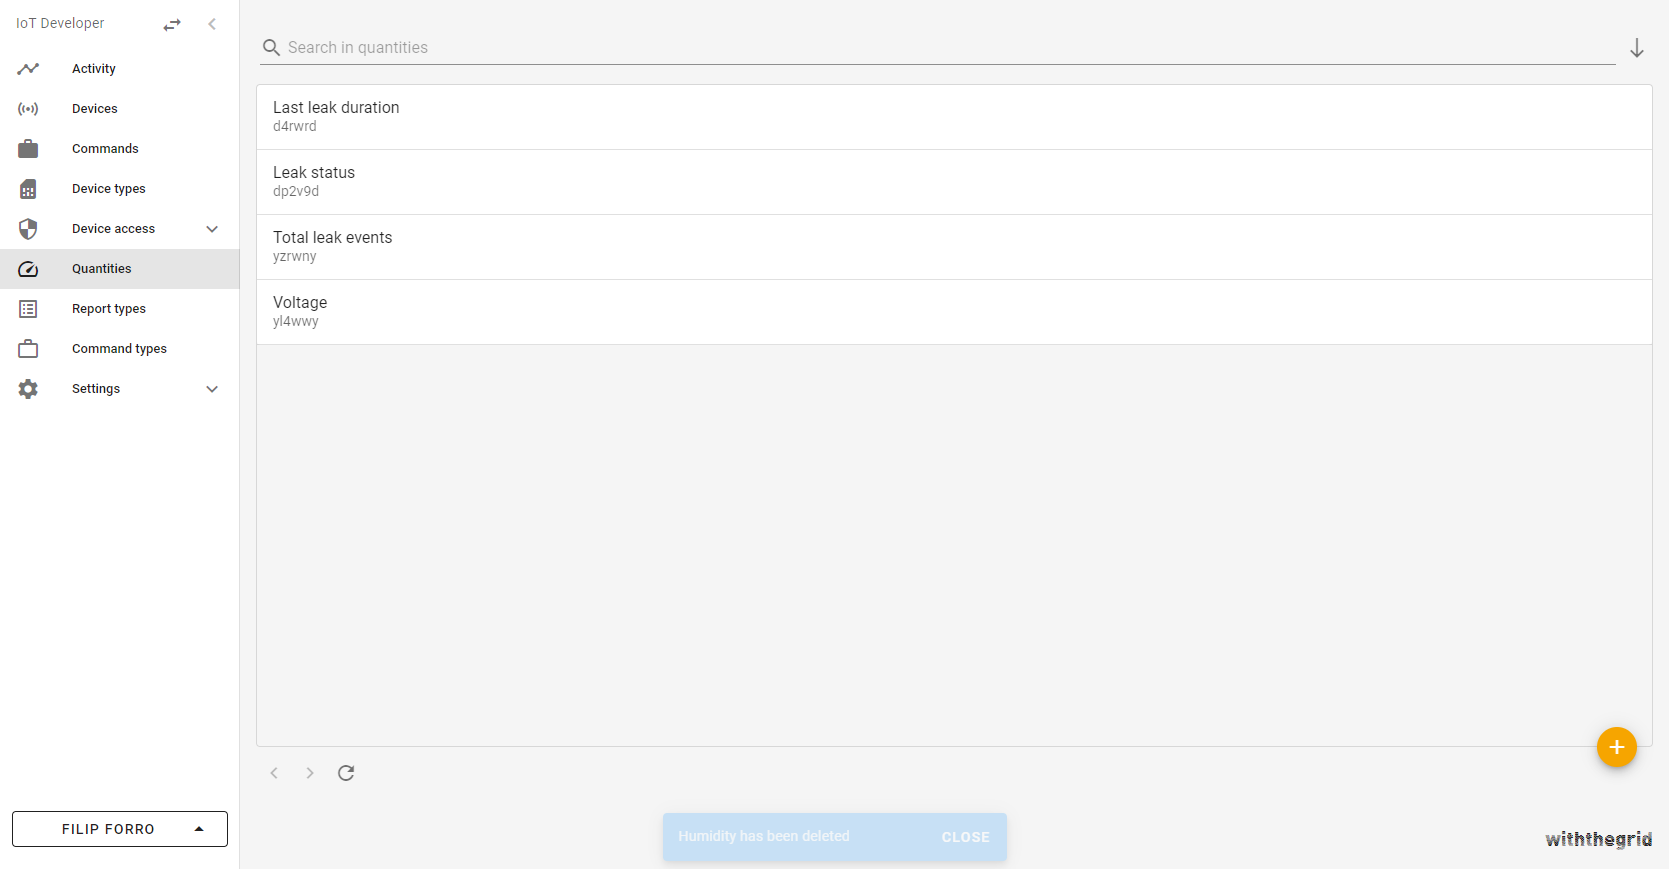
Figure 17. List of existing quantities
Step 5: Configuring the created webhook
The webhook created in step 2 can be edited by navigating to Webhooks, selecting the newly created The Things Stack webhook, and clicking EDIT THE IDENTIFIER. The platform provides a template and a direct link to the webhook documentation. The following webhook will pass the payload from The Things Stack, together with the device type hashID to the appropriate event handler. Lastly, the webhook will also return a deviceIdentifier, e.g. the IMEI of the device.
type JsonObject = { [key: string]: Json };

const ttsApplicationIds = {
  dragino: {
    waterLeak: "dwl",
  },
};

const deviceTypeHashIds = {
  dragino: {
    waterLeak: "4djrvd",
  },
};

function handle(args: Arguments): Result {
  const data = getJsonObject(args.request.body?.data);
  let deviceTypeHashId;

  switch (data?.end_device_ids?.application_ids.application_id) {
    case ttsApplicationIds.dragino.waterLeak:
      deviceTypeHashId = deviceTypeHashIds.dragino.waterLeak;
      break;

    default:
      throw new Error(JSON.stringify(data?.end_device_ids));
  }

  const deviceIdentifier = data.end_device_ids.dev_eui;
  if (typeof deviceIdentifier !== "string") {
    throw new Error("Hardware serial is not available");
  }

  return {
    deviceTypeHashId,
    deviceIdentifier,
  };
}

function getJsonObject(data: Json | undefined): any {
  if (typeof data === "object" && data !== null && !Array.isArray(data)) {
    return data;
  } else {
    throw new Error("Data must be a JSON object!");
  }
}
Step 6: Configuring device type
The device type that we have created will forward the payload to the report type (which we will create in step 8) where it will be parsed. The following code will validate the request and forward the actual payload generated by the sensor to the report parser.
// define the hashId of the reportType
const reportTypeHashId = "eyr96d";

/**
 * Handle is the required function. It has two overloads, one for incoming HTTP requests and one for internal events
 * When this function is called for an incoming HTTP requests, the function should return information about the response
 * that should be returned.
 */
function handle(
  args: ArgumentsForIncomingRequestEvent,
  exec: Exec
): IncomingRequestResponse;
function handle(args: ArgumentsForEventWithoutResponse, exec: Exec): void;
function handle(args: Arguments, exec: Exec): IncomingRequestResponse | void {
  if (args.event.type === "incomingRequest") {
    const request = args.event.webRequest;

    if (request.method === "POST" && request.url.path === "/") {
      if (request.body === undefined || request.body.type !== "json") {
        return {
          statusCode: 400,
          body: ["parameter_error", "Body is not of type JSON"],
        };
      }

      const payload = JSON.parse(JSON.stringify(request.body.data));
      if (payload.join_accept !== undefined) {
        return {
          statusCode: 204,
          body: ["The Things Stack is registering!"],
        };
      }

      // Set receive timestamp
      let generatedAt = new Date();
      generatedAt.setMilliseconds(0);

      // pass parsing of the report to the right report type parser
      exec.parseReport({
        reportTypeHashId,
        payload: JSON.stringify({
          generatedAt,
          payload: request.body.data,
        }),
      });

      return { statusCode: 204 };
    }

    return {
      statusCode: 404,
      body: ["not_found_error", "Route cannot be found"],
    };
  }
}
Step 7: Configuring The Things Stack
Now that the webhook and the event handler of the Dragino - LWL02 device are configured, we can proceed with setting up The Things Stack.
Create an application and add the Dragino device by following linked tutorials.
After the device is registered, we can configure a new webhook on The Things Stack. Set the webhook format to JSON and enter the Base URL provided with the Withthegrid webhook we created in step 2.
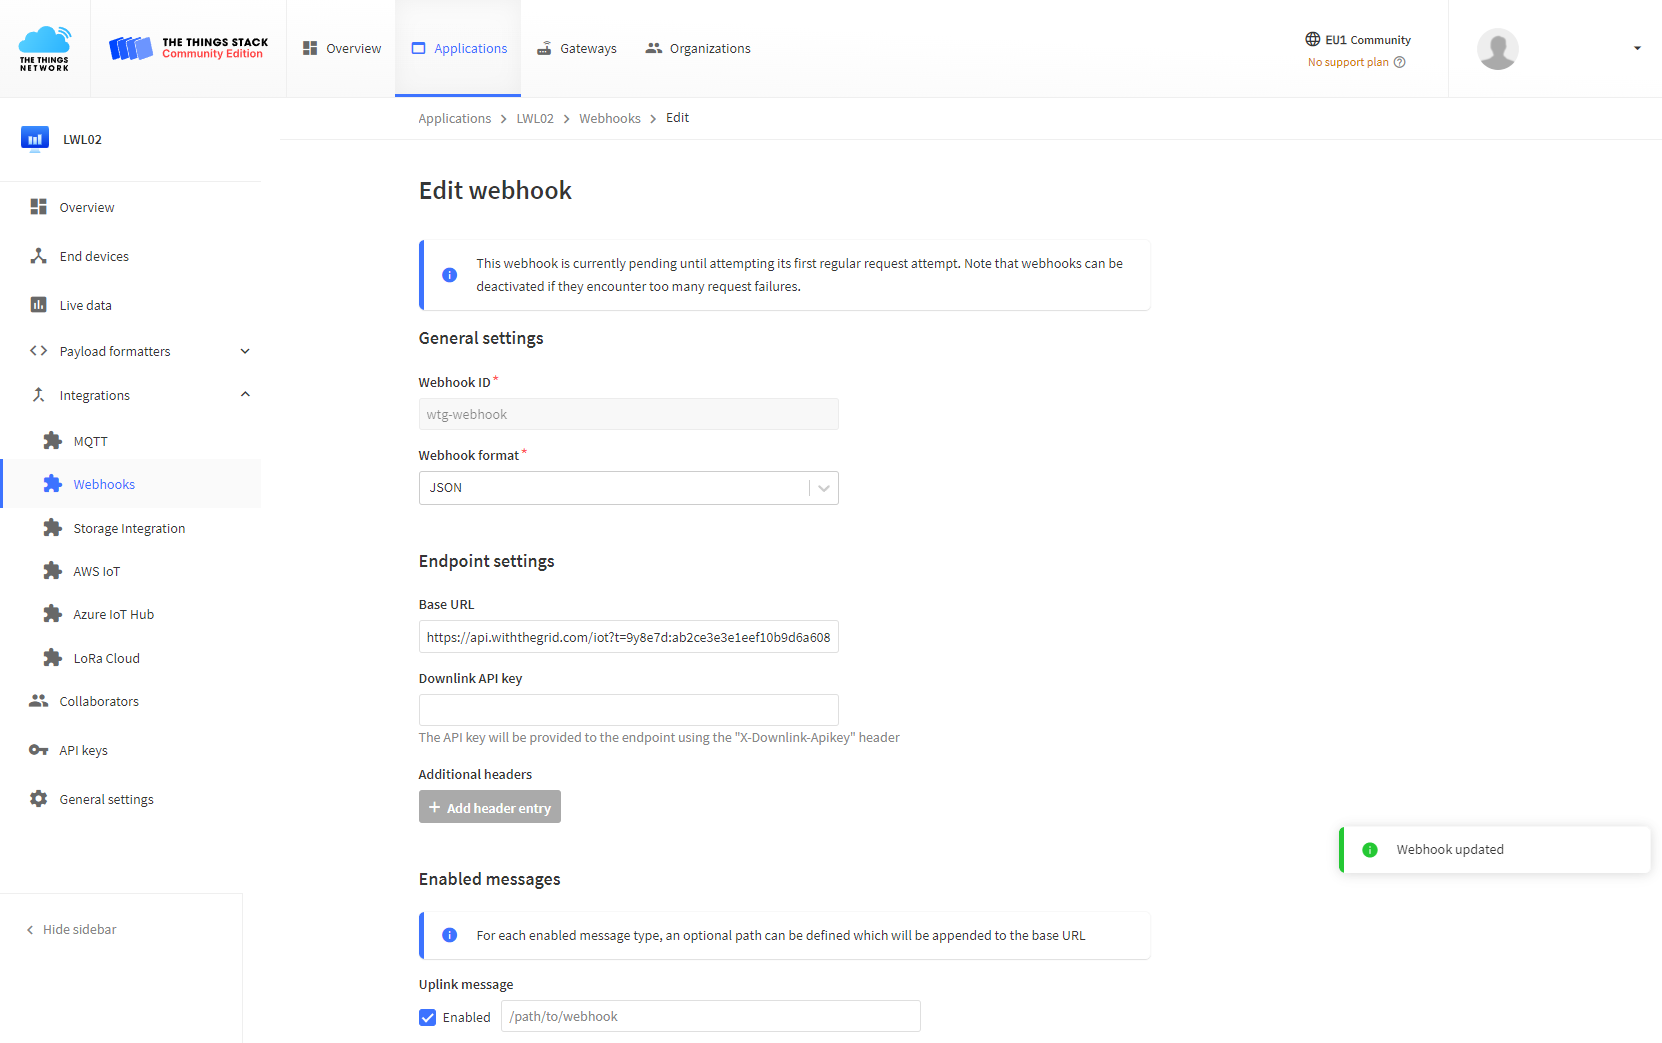
Figure 20. Configure The Things Stack webhook
Step 8: Configuring report type
The next step is to correctly configure the created report type such that it can decode the incoming payload into physical measurements. The Things Network makes this easy because the payload is already decoded. We only need to push the measurements to correct channels. Voltage measurement should be pushed into Internal Sensor channel which is the first channel, therefore, has a channelIndex of 0. Measurements related to Probe should be pushed to a channelIndex of 1.
/**
 * Source: http://www.dragino.com/downloads/downloads/LoRa_End_Node/LDS01/LDS01_LoRaWAN_Door_Sensor_UserManual_v1.2.0.pdf
 */
const operatingVoltageQuantityHashId: string = "yl4wwy";
const leakStatusQuantityHashId: string = "dp2v9d";
const totalLeakEventsQuantityHashId: string = "yzrwny";
const lastLeakDurationQuantityHashId: string = "d4rwrd";

const sensorConditionChannelIndex: number = 0;
const leakChannelIndex: number = 1;

function handle(args: Arguments, exec: Exec): Result {
  const data = JSON.parse(args.payload);
  if (typeof data !== "object" || data === null) {
    throw new Error("Data is not a JSON-object");
  }

  const generatedAtMs = Date.parse(data.generatedAt);
  if (Number.isNaN(generatedAtMs)) {
    throw new Error("generatedAt cannot be parsed into a valid Date");
  }
  const generatedAt = new Date(generatedAtMs);

  let payload = data.payload.uplink_message.decoded_payload;
  exec.addLog(JSON.stringify(typeof payload.BAT_V));

  const operatingVoltage = payload.BAT_V;
  const waterLeakStatus = payload.WATER_LEAK_STATUS;
  const totalOpenLeakEvents = payload.WATER_LEAK_TIMES;
  const lastLeakDuration = payload.LAST_WATER_LEAK_DURATION;

  /**
   * Use with raw payload
   */
  // const payload = data.payload;
  // const decodedPayload = exec.base64ToUInt8Array(payload);
  // const operatingVoltage = (decodedPayload[0] << 8 | decodedPayload[1]) & 0x3FFF;
  // const waterLeakStatus = decodedPayload[0] & 0x40 ? 1 : 0;
  // const totalOpenLeakEvents = decodedPayload[3] << 16 | decodedPayload[4] << 8 | decodedPayload[5];
  // const lastLeakDuration = decodedPayload[6] << 16 | decodedPayload[7] << 8 | decodedPayload[8];

  const measurements: Result["measurements"] = [];

  pushMeasurement(
    measurements,
    sensorConditionChannelIndex,
    operatingVoltageQuantityHashId,
    generatedAt,
    -3,
    operatingVoltage * 1000
  );
  pushMeasurement(
    measurements,
    leakChannelIndex,
    leakStatusQuantityHashId,
    generatedAt,
    0,
    waterLeakStatus
  );
  pushMeasurement(
    measurements,
    leakChannelIndex,
    totalLeakEventsQuantityHashId,
    generatedAt,
    0,
    totalOpenLeakEvents
  );
  pushMeasurement(
    measurements,
    leakChannelIndex,
    lastLeakDurationQuantityHashId,
    generatedAt,
    0,
    lastLeakDuration
  );

  return {
    generatedAt,
    measurements,
    fields: {},
  };
}

function pushMeasurement(
  measurements: Result["measurements"],
  channelIndex: number,
  quantityHashId: string,
  generatedAt: Date,
  orderOfMagnitude: number,
  significand: number
) {
  measurements.push({
    channelIndex: channelIndex,
    quantityHashId: quantityHashId,
    generatedAt: generatedAt,
    orderOfMagnitude: orderOfMagnitude,
    significand: significand,
  });
}
Step 9: Powering up the device
After powering up the device it should automatically connect to the Withthegrid application. The successful connection can be observed in the connectivity environment under Activity and it will look like this:
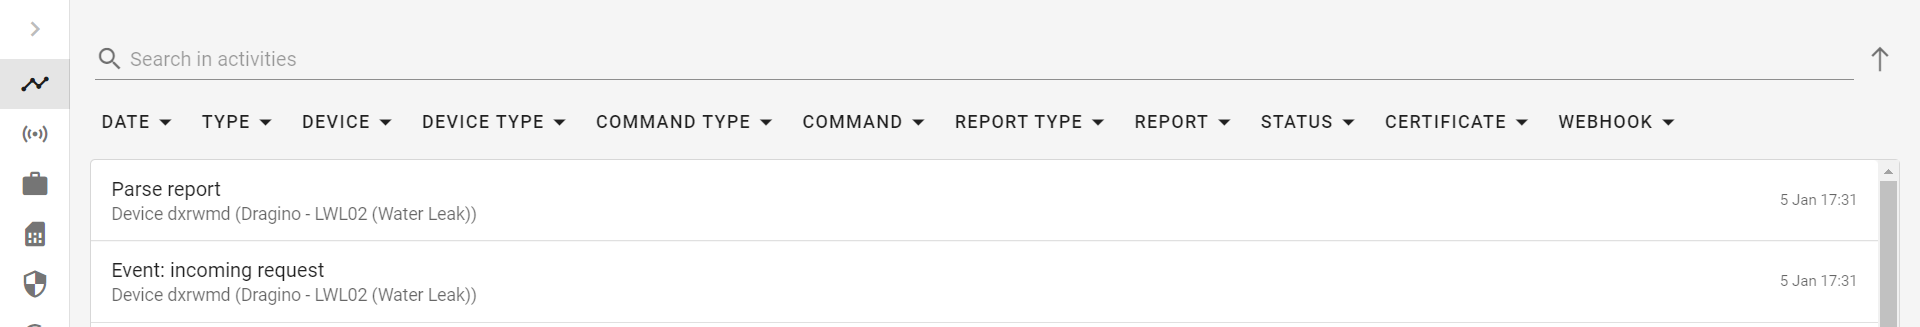
Figure 20. Activity overview
You can click on Parse report to view more information and verify that the parsing is correct.
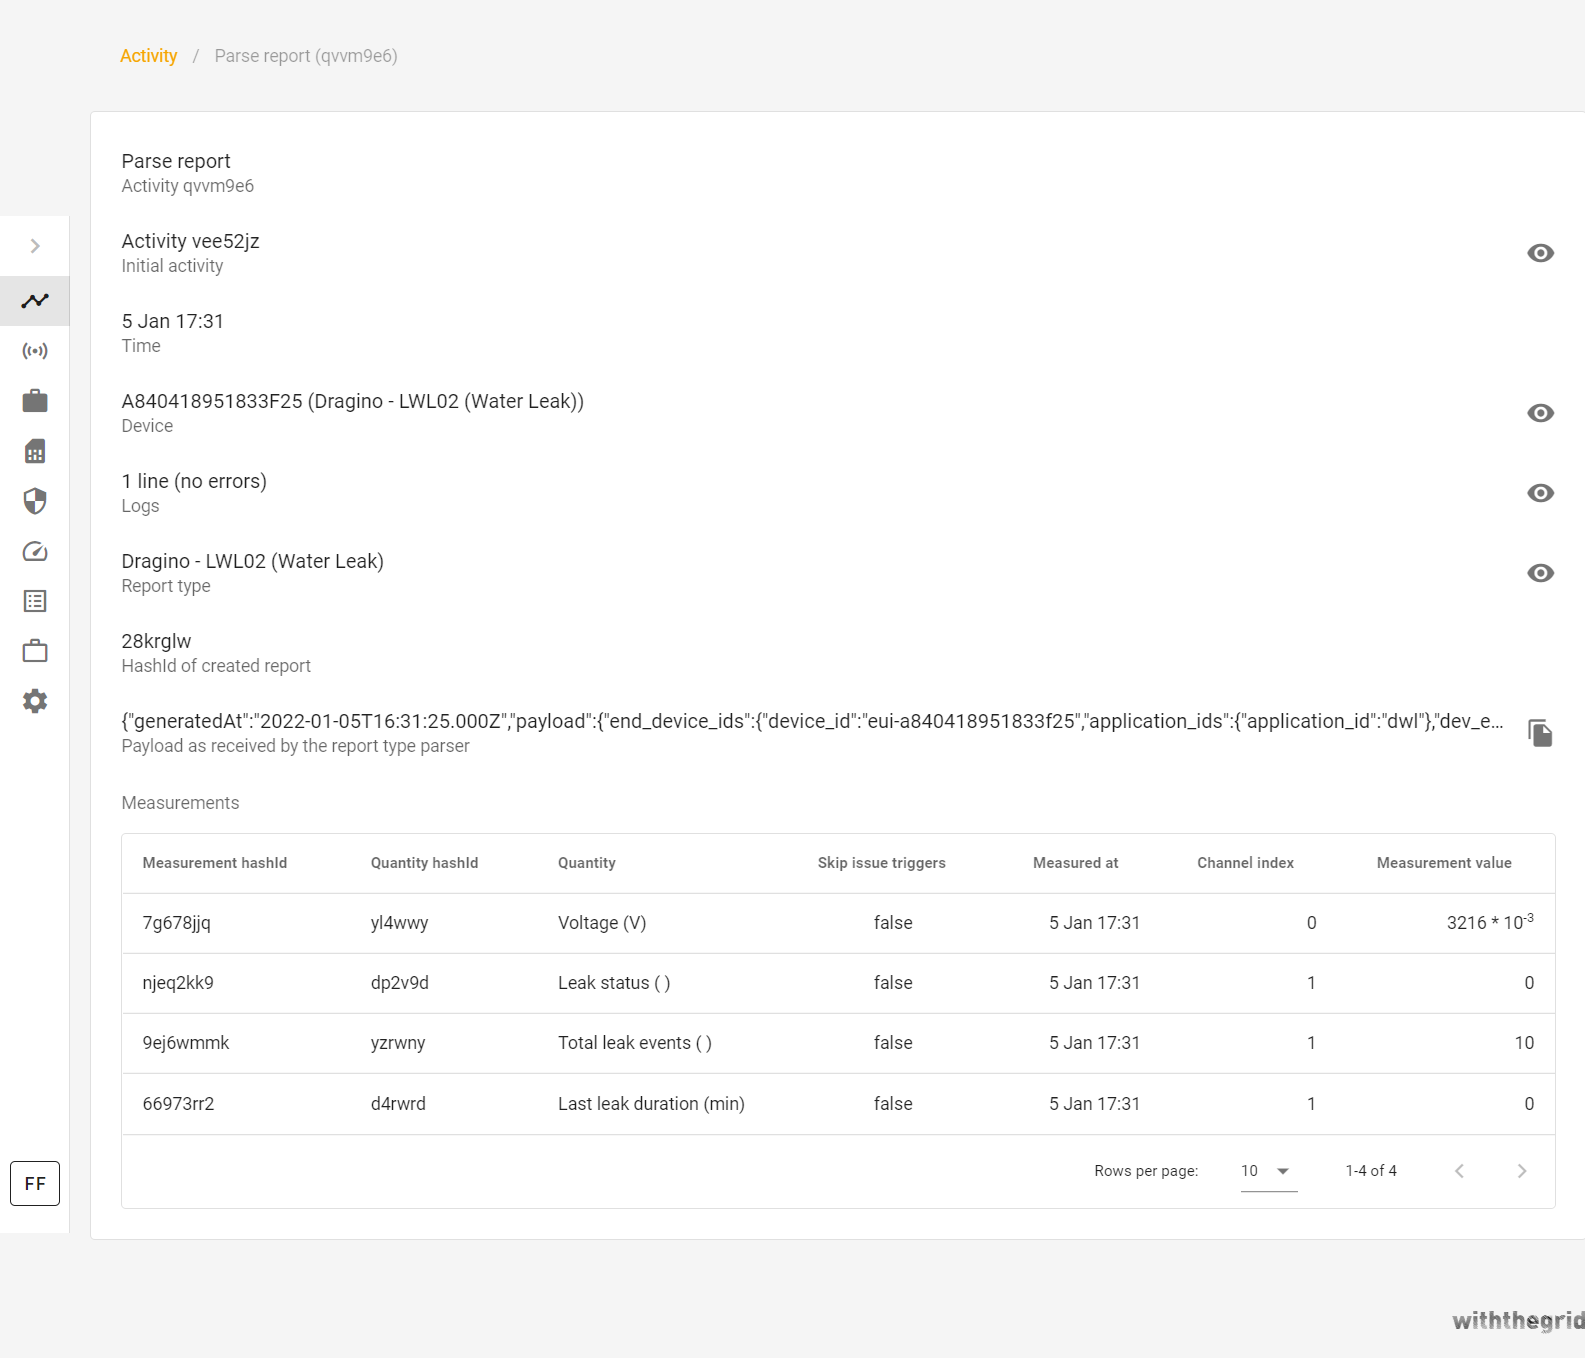
Figure 21. Example of the parsed report
Step 10: Claiming device tokens
When the sensor is linked for the first time, the instance of the device is created in the platform and can be found in Devices. The corresponding device will have a unique hashID (e.g. dxrwmd), Identifier (in our case IMEI of the device), and will be of device type Dragino - LWL02. The device can be easily placed in any monitoring environment by selecting GET CLAIM TOKEN(S) in the bottom right corner.
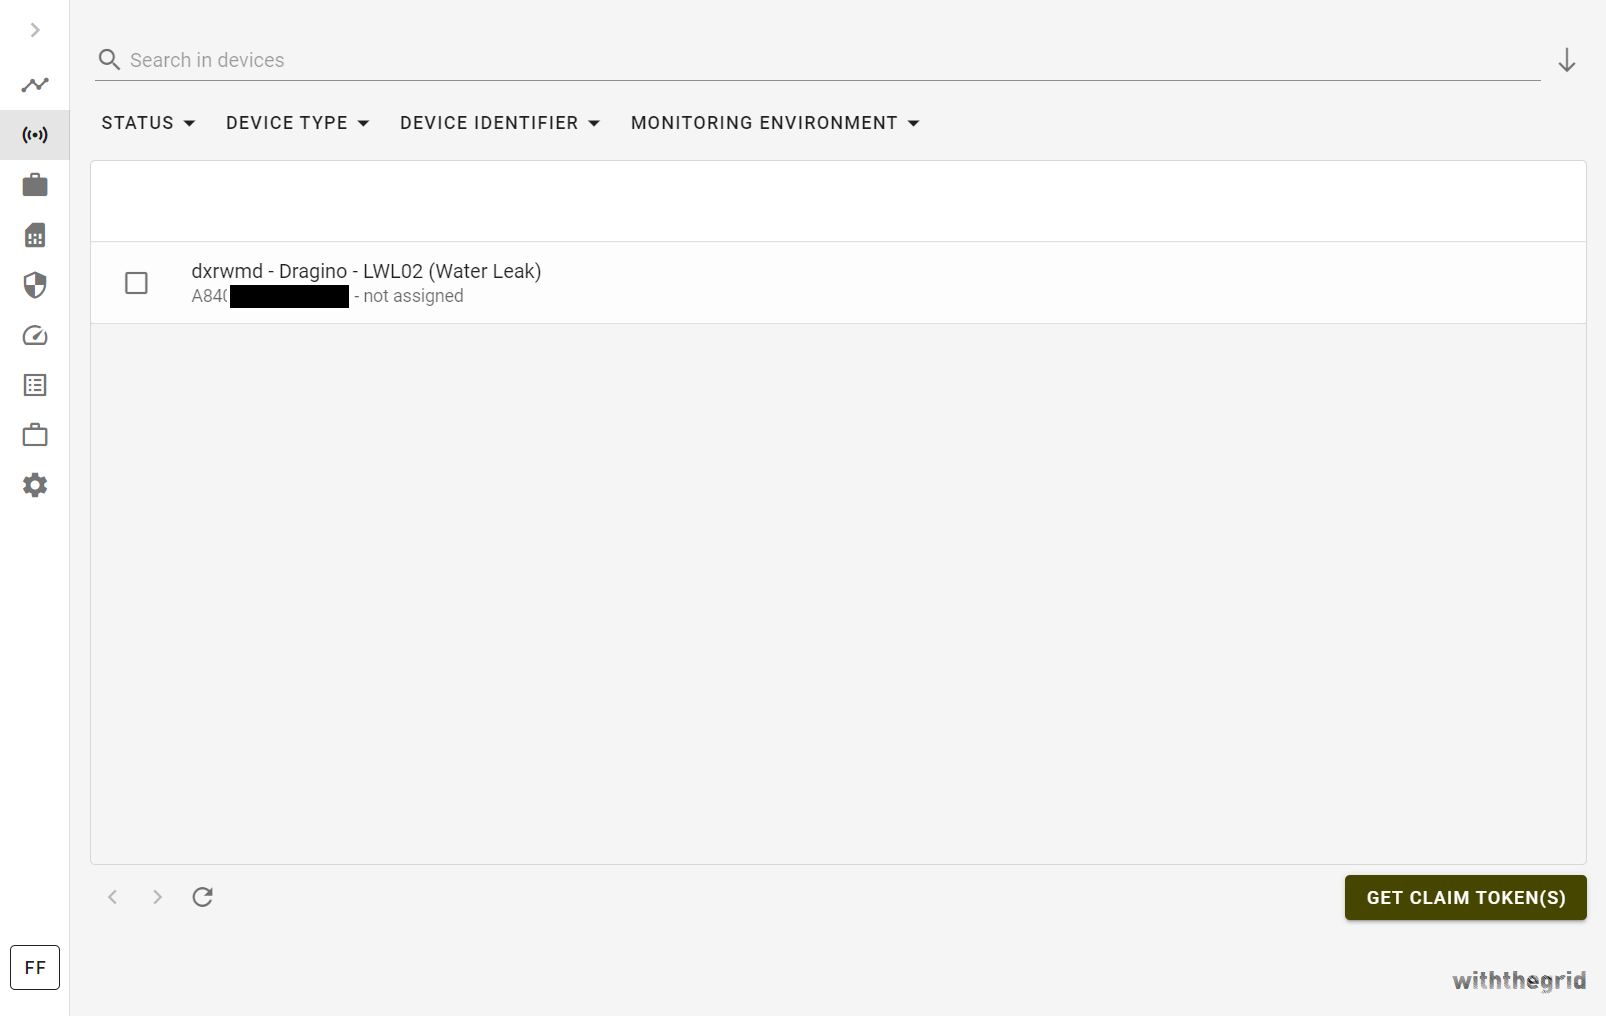
Figure 22. Devices overview
Enter the hashID of a device to be claimed and click REQUEST.
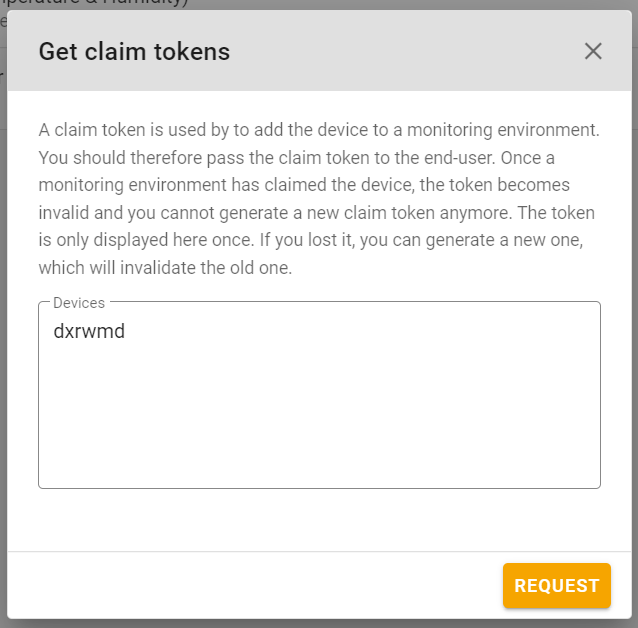
Figure 23. Get claim tokens with device hash IDs
The platform will output a claim token that can be copied.
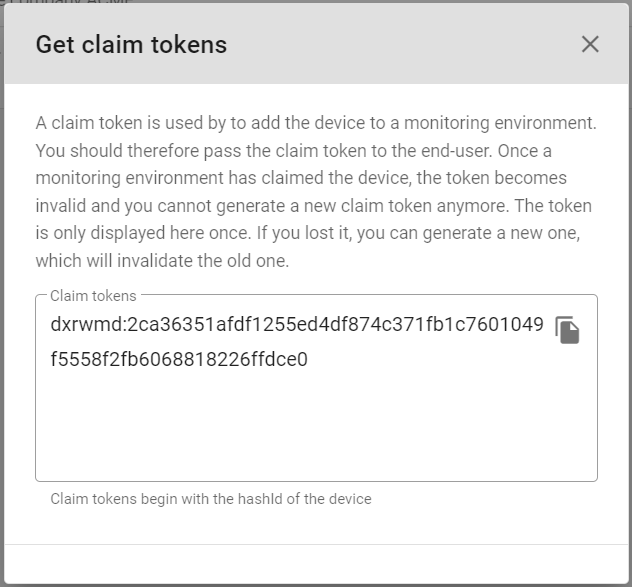
Figure 24. Claim generated token
In the last step, we will configure the monitoring environment and add the newly connected sensor.
Step 11: Configuring the monitoring environment
To add a device into the monitoring environment, navigate to Devices, click +, and enter the previously copied claim token. Click ADD.
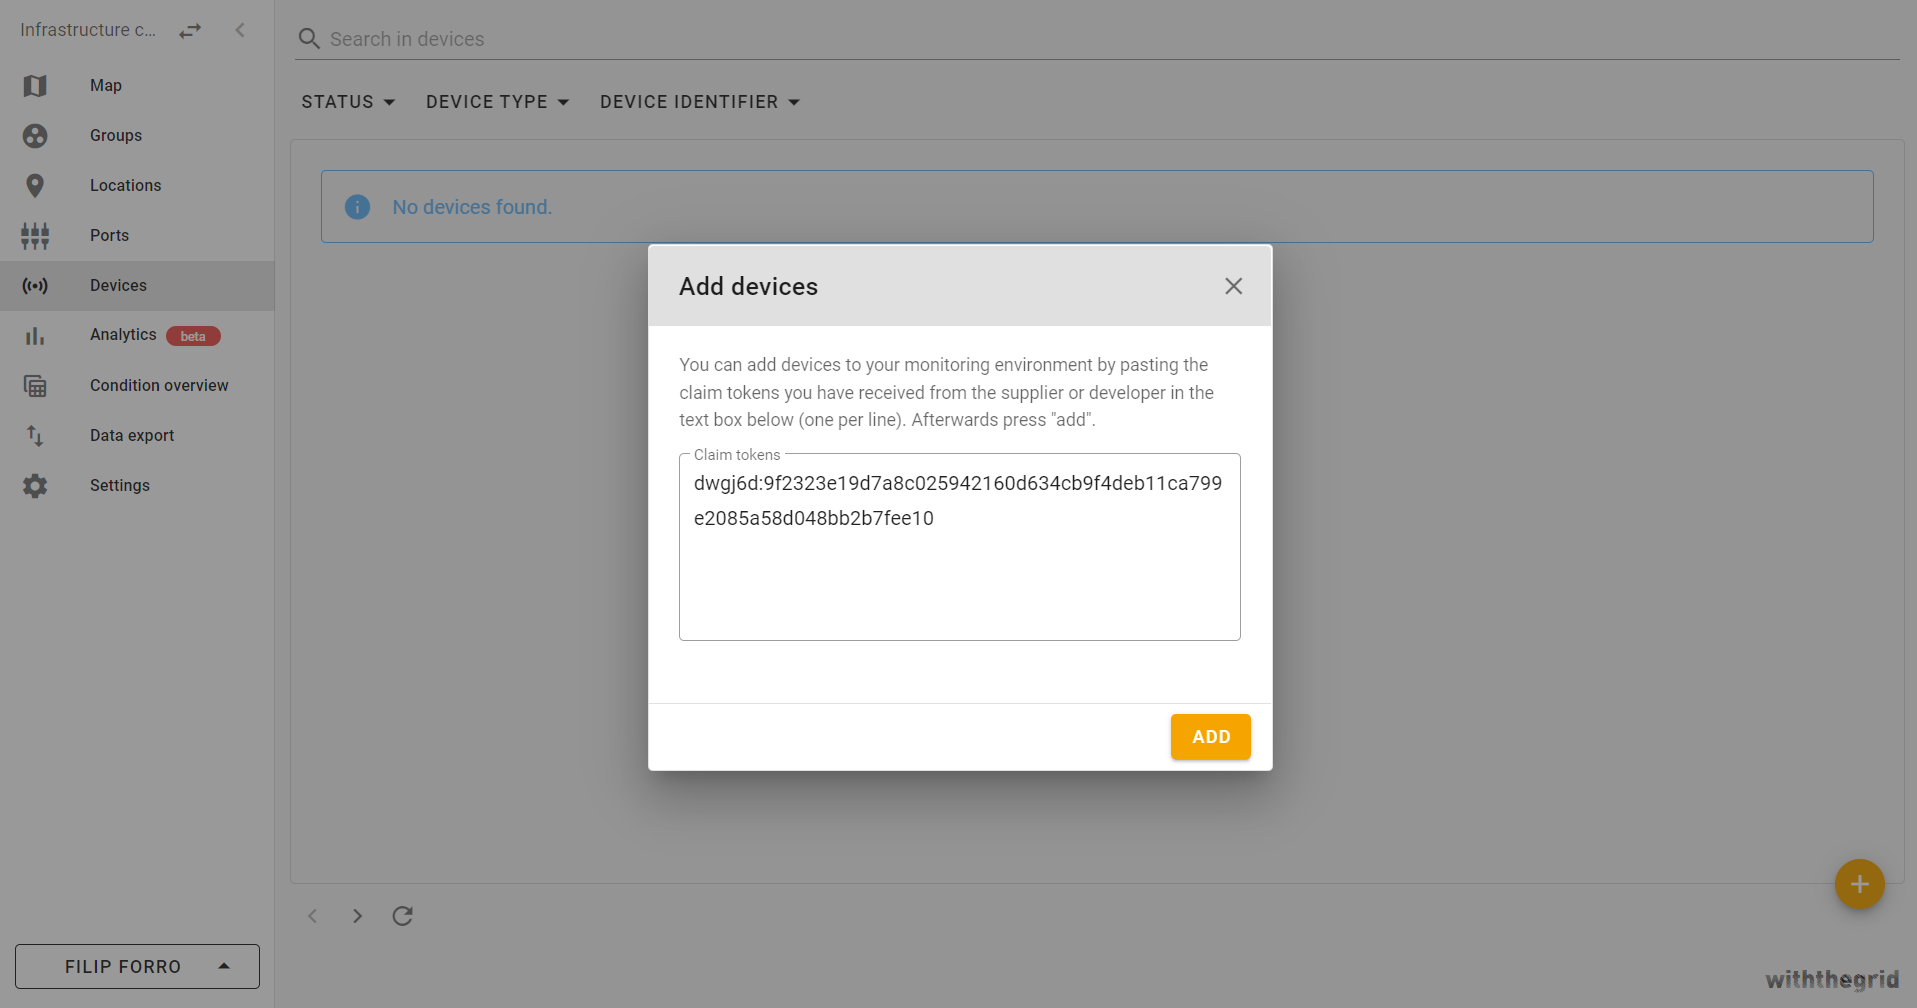
Figure 25. Claim device in the monitoring environment
The following image shows that the device is registered in the monitoring environment, however, is not installed yet.
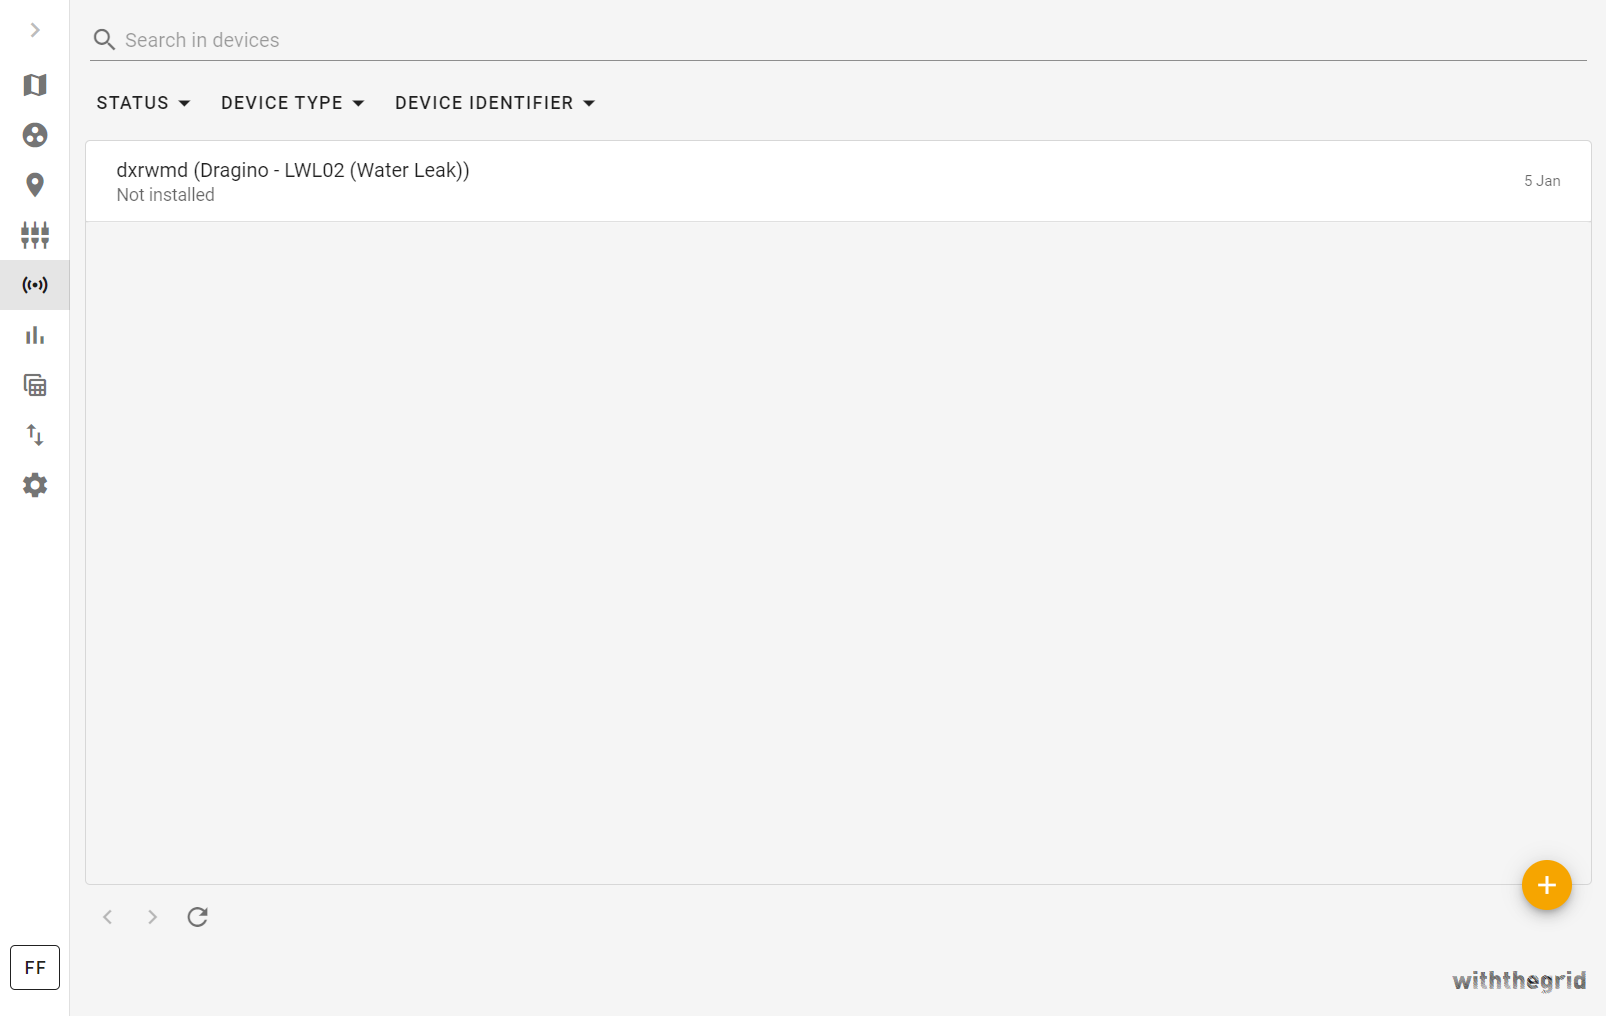
Figure 26. Available devices
To install a device, navigate to the created location (ACME Headquarters) and select Devices.
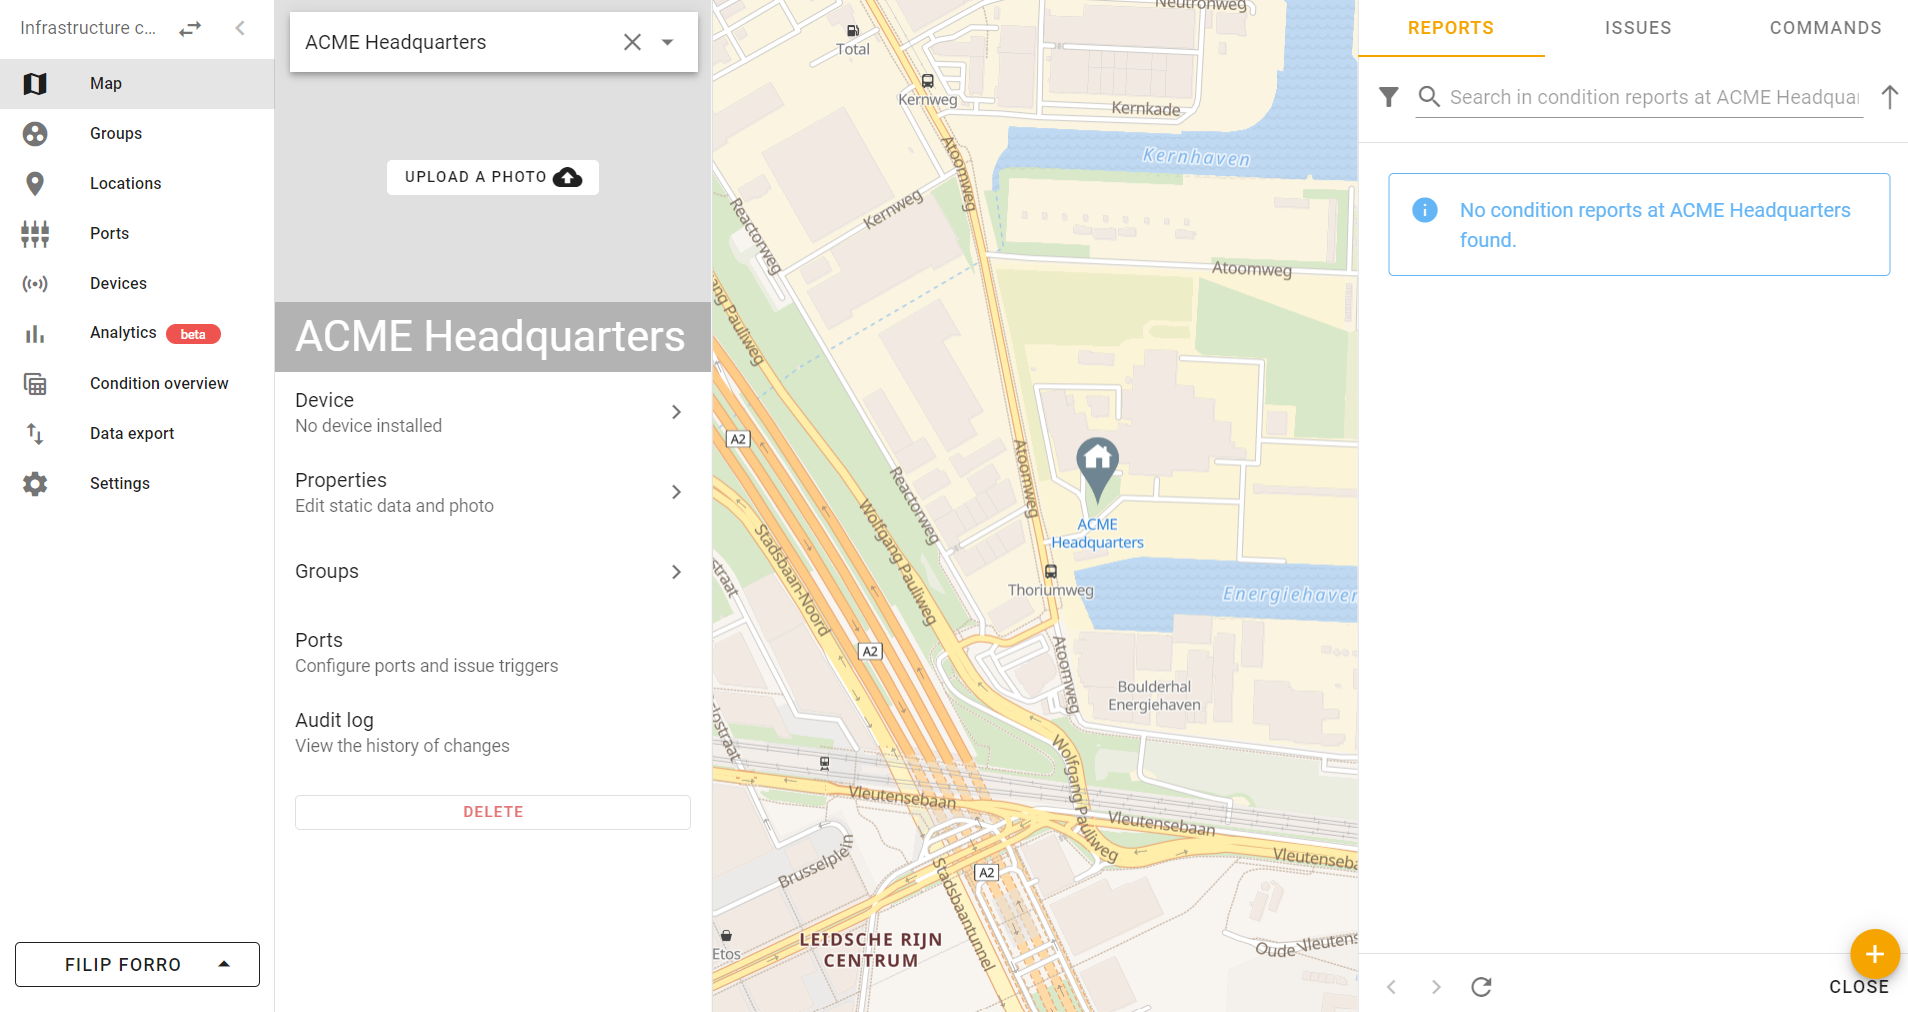
Figure 27. Add a device to location
In Link to a device, select the Dragino - LWL02. Finally, we would like to track the Internal Sensor port and Probe port onto which measurements are pushed. Click + PORT to add the Internal Sensor channel and repeat to add the Probe channel. Finalize the device installation with SET.
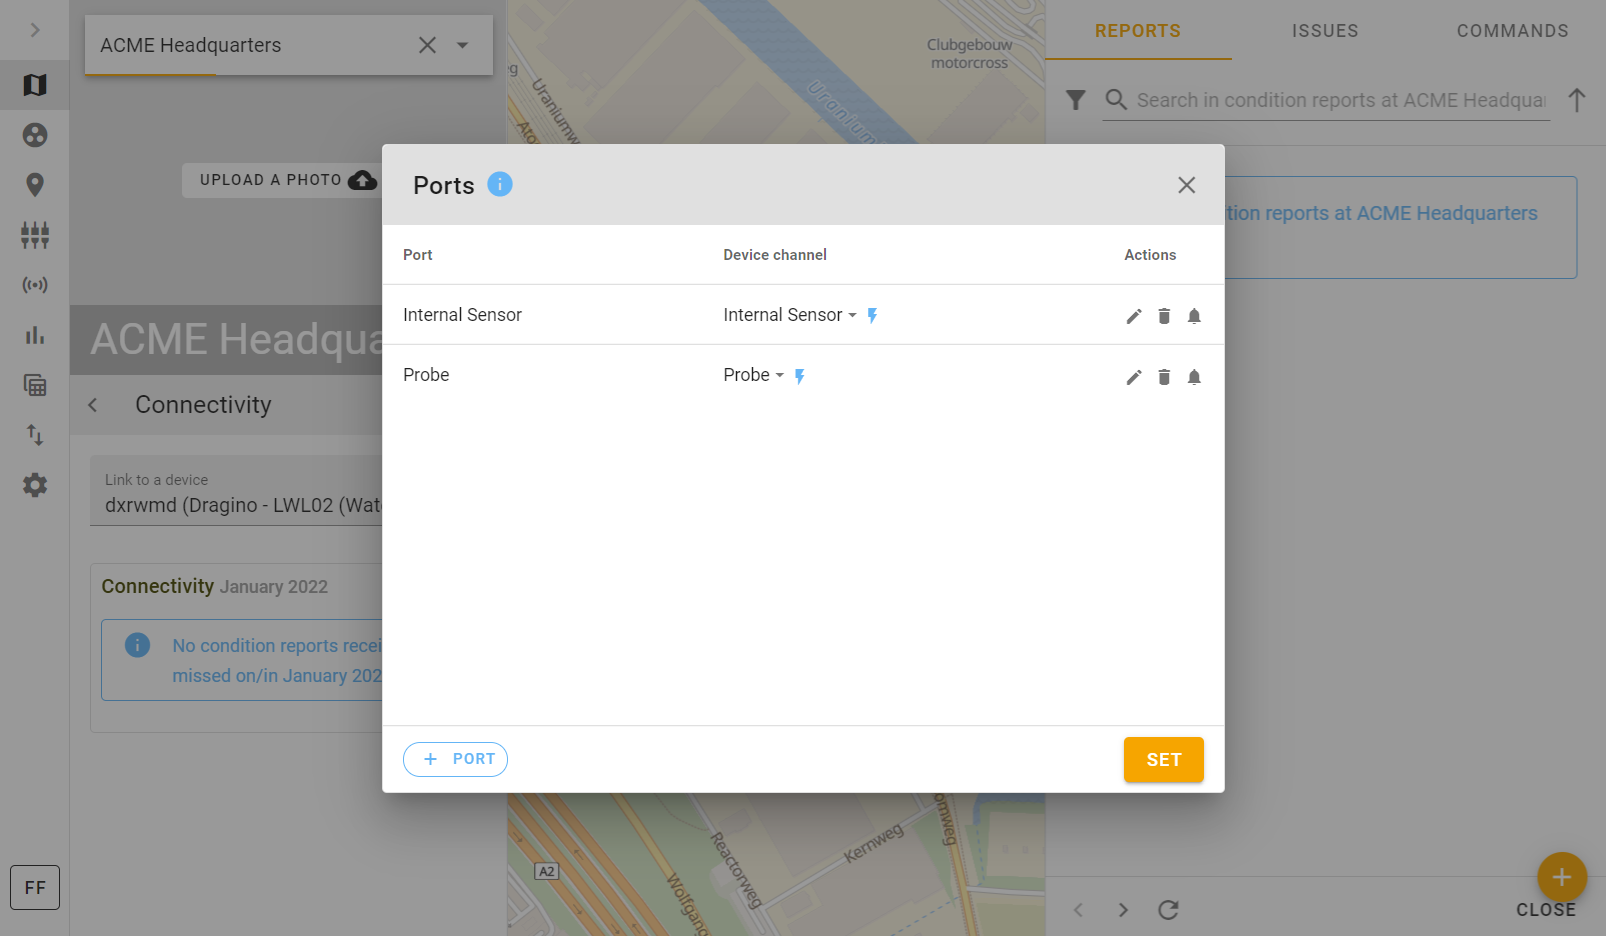
Figure 28. Set device ports
From this point on, all measurements pushed to channels of Dragino - LWL02 sensor with the unique IMEI will be available in the monitoring environments, ready to be visualized in graphs. Try shorting the two pins on the sensor to see if a measurement is recorded.
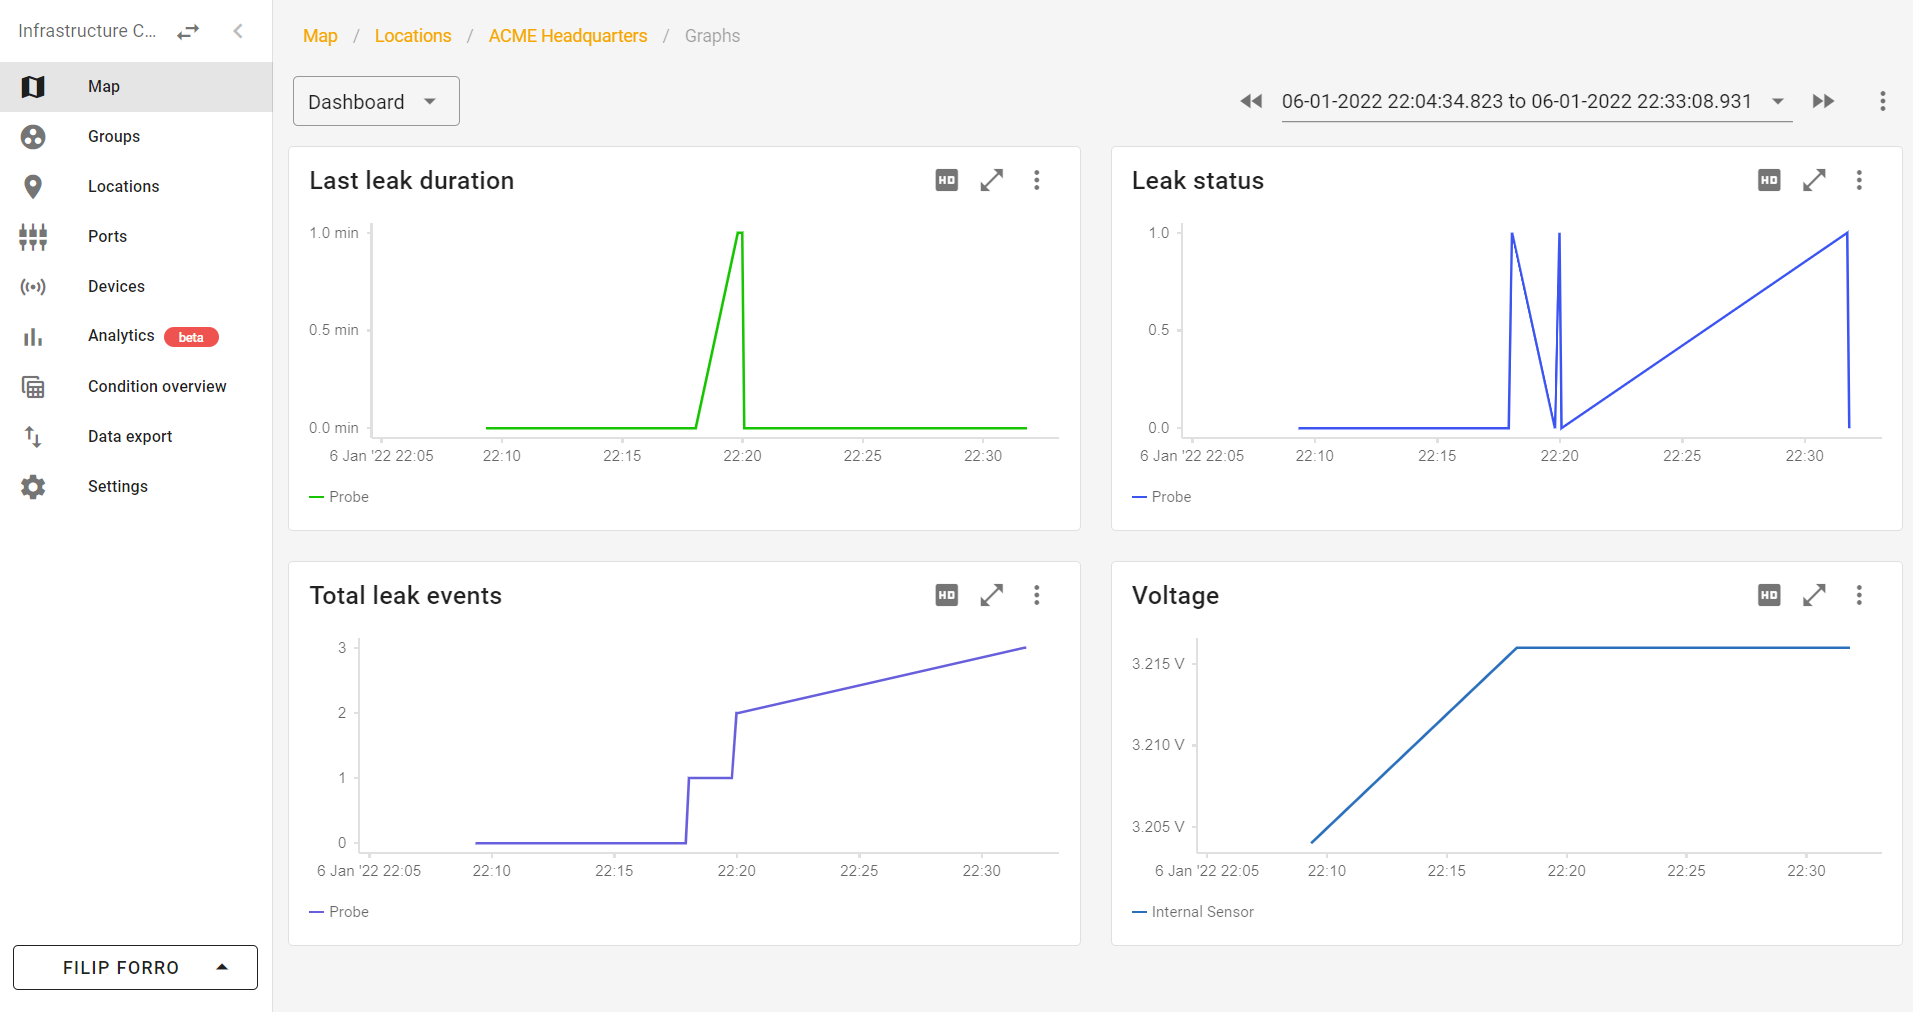
Figure 29. Visualize data
Congratulations! If you can see measurements in the graphs, you have successfully finished the tutorial. If you want to learn more about all the cool functionalities that the Withthegrid platform offers, do not hesitate to look at our documentation or contact us directly through withthegrid.com.