The Things Stack supports publishing of uplink messages directly to the AWS IoT suite.
Warning:
This integration will be removed in a next version. Please switch to the Default Integration instead.AWS IoT suite can be used to subscribe to detailed uplink messages as well as get insights into aggregated metrics of your uplink data.
Note:
This only works if The Things Stack runs in your AWS account, i.e. in a Enterprise or AWS Launcher deployment. When using the AWS Marketplace AMI listing, the AWS IoT Telemetry option in the CloudFormation template must be set to true during the deployment phase.Setup
- Login to the AWS Console in the same region as where the CloudFormation template is deployed.
- Search for IoT Core service and click to enter the IoT Core window.
- On the left-hand panel, select the Test option. In the central panel, choose Subscribe to a topic.
- In the Subscription topic field enter
lorawan/<cloud-formation-stack-name>/<application-id>/things/<device-id>/upto subscribe to the uplinks for a particular device. For example, if your CloudFormation stack name ismy-lorawan-server, the application ID ismy-motion-sensorsand the device ID ismy-motion-sensor-1, then the topic would belorawan/my-lorawan-server/my-motion-sensors/things/my-motion-sensor-1/up. When the device sends an uplink message, it will be displayed in this window in the preferred format. The following is an example payload in JSON format:
{
  "format": "json",
  "payload": {
    "end_device_ids": {
      "device_id": "my-motion-sensor-1",
      "application_ids": {
        "application_id": "my-motion-sensors"
      },
      "dev_eui": "xxxxxxxxxxxxxxxx",
      "join_eui": "xxxxxxxxxxxxxxxx",
      "dev_addr": "009C0D6F"
    },
    "correlation_ids": [
      "as:up:01DYMZ1NKBT0B8NACFV6NJWG2J",
      "gs:conn:01DYMY19DNK1R2EG9P79YQYB97",
      "gs:uplink:01DYMZ1NCF2NAX6HJS3TX6SKAH",
      "ns:uplink:01DYMZ1NCGW37WNSSKKJR86515",
      "rpc:/ttn.lorawan.v3.GsNs/HandleUplink:01DYMZ1NCGB9FBVPQK74WA20YT"
    ],
    "received_at": "2020-01-15T16:02:10.668892406Z",
    "uplink_message": {
      "session_key_id": "AW+poh7YEnPnhTgVoA5a2A==",
      "f_port": 102,
      "f_cnt": 13,
      "frm_payload": "AdsmAADiAAA=",
      "decoded_payload": {
        "bat_percentage": 86.66666666666667,
        "count": 226,
        "events": "motion",
        "status": 1,
        "temp": 6,
        "time": 0,
        "voltage": 3.6
      },
      "rx_metadata": [
        {
          "gateway_ids": {
            "gateway_id": "tektelic-1",
            "eui": "xxxxxxxxxxxxxxxx"
          },
          "timestamp": 1453994219,
          "rssi": -3,
          "channel_rssi": -3,
          "snr": 9.5,
          "uplink_token": "CiMKIQoVdGVrdGVsaWMtZGVzay1nYXRld2F5Eghkf9r//gBccRDr4ai1BQ==",
          "channel_index": 1
        }
      ],
      "settings": {
        "data_rate": {
          "lora": {
            "bandwidth": 125000,
            "spreading_factor": 7
          }
        },
        "coding_rate": "4/5",
        "frequency": "867300000",
        "timestamp": 1453994219
      },
      "received_at": "2020-01-15T16:02:10.448769590Z"
    }
  },
  "qos": 0,
  "timestamp": 1579104130996,
  "topic": "lorawan/my-lorawan-server/my-motion-sensors/things/my-motion-sensor-1/up"
}
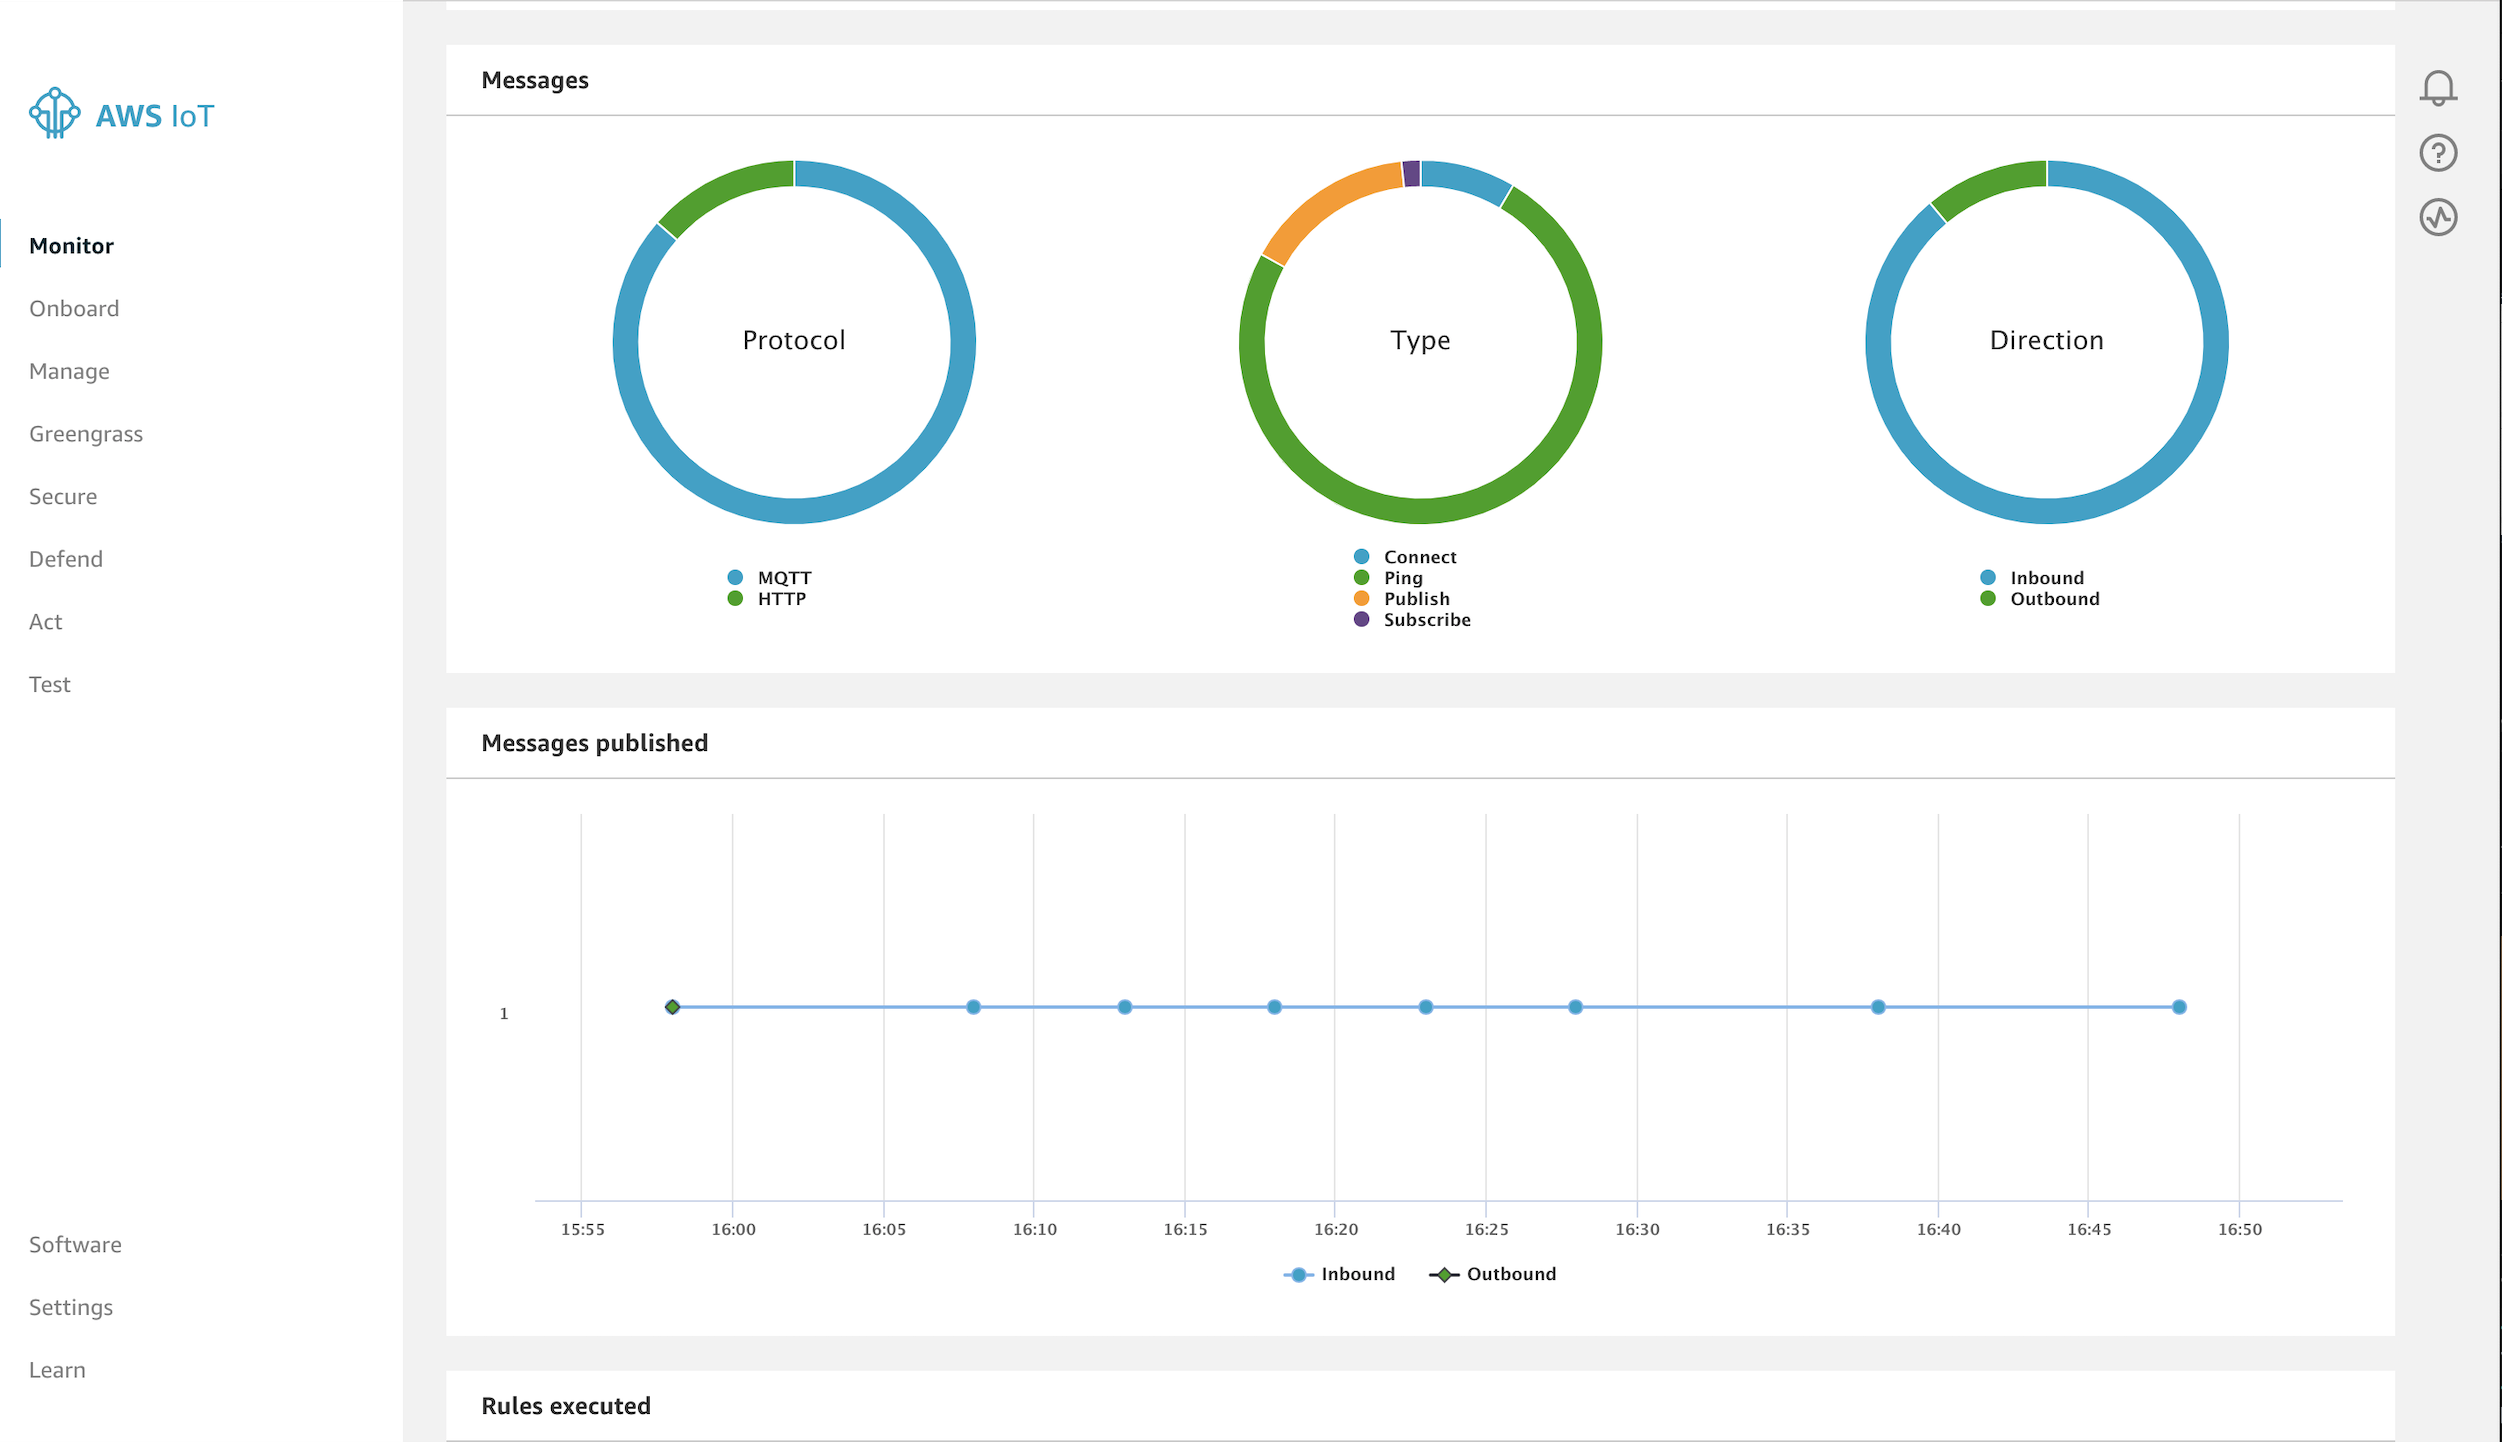
Monitoring
On the left-hand panel, click on the Monitor option for aggregated metrics on uplink data. The Sample period and Time range can be adjusted using the drop down links on the top right-hand corner. The following is a sample of the Messages and Messages published windows for an hour sampled every 5 minutes.